See the Tabbed Pages for links to video tutorials, and a linked list of post titles grouped by topic.

This blog is expressly directed to readers who do not have strong training or backgrounds in science, with the intent of helping them grasp the underpinnings of this important issue. I'm going to present an ongoing series of posts that will develop various aspects of the science of global warming, its causes and possible methods for minimizing its advance and overcoming at least partially its detrimental effects.

Each post will begin with a capsule summary. It will then proceed with captioned sections to amplify and justify the statements and conclusions of the summary. I'll present images and tables where helpful to develop a point, since "a picture is worth a thousand words".

Tuesday, January 25, 2011

Carol Browner, President Obama’s Climate Policy Assistant, Will Leave

President Barack Obama’s Assistant to the President for Energy and Climate Change Assistant for Energy and Climate Change, Carol Browner, is leaving her position in the White House, the New York Times reported today.  The Obama administration entered office with ambitious goals concerning the environment, including the need to combat global warming.  During Ms. Browner’s tenure, the U. S. House of Representatives passed climate control legislation whose goal was to reduce emissions of greenhouse gases.  Its central feature was establishing a cap-and-trade regime for controlling emissions.  The House bill foundered in the U. S. Senate, where significant opposition to the need for controlling emissions is found.  Even though Democrats, members of Pres. Obama’s own party, held a solid majority in the Senate, certain of them from states that produce fossil fuels sided with the opposition to prevent passage.  Their concerns included that jobs involved in production would be lost.

Under cap-and-trade, a restricted number of permits that authorize the release of CO2 and other greenhouse gases is issued to emitters of the gases.  Each permit allows the release of a fixed amount of gas.  The number issued establishes the cap.  The permits can be freely traded, once issued, among the various sources of emissions, such that efficient enterprises would have an excess number of permits, which could trade for a market value to emitters that needed extra permits.  In successive years of such a program, the number of permits is reduced, so that greenhouse gas emissions are lowered.

In the absence of a national regime for reining in the greenhouse gases that cause global warming, regional initiatives involving groups of states have embarked on this path: the Western Climate Initiative, the Midwestern Greenhouse Gas Reduction Accord and the Regional Greenhouse Gas Initiative of northeastern states.

Press reports indicate that the administration has not decided whether to appoint a successor or simply to let the position and its office disappear.  Regardless, the case for bold environmental initiatives in the coming period of the Obama administration is far weaker than at the outset.  The new Chief of Staff, William Daley, has strong corporate experience.  The capture of the House of Representatives by a Republican majority, and strengthening of the Republican role in the Senate stymie the chances for strong environmental legislation in the next two years. 

Ms. Browner’s other accomplishments while in office include managing the BP oil spill in the Gulf of Mexico last year, and extending the fuel efficiency of cars sold in the U. S., increasing the gas mileage by 25% over the next 5 years.

Earlier, she had been the Administrator of the Environmental Protection Agency for the duration of President Bill Clinton’ administration.  During her tenure she streamlined and strengthened the internal operations of the agency, defended environmental legislation from attack by Republicans after they gained control of the House of Representatives in 1994, and oversaw statutory expansion of the Clean Air Act and the Clean Water Act.   She also began EPA’s regulatory program to combat global warming, developing authority of the EPA to control greenhouse gas emissions.  This and several other initiatives were reversed under the following administration, that of President George W. Bush.

© 2011 Henry Auer

Saturday, January 22, 2011

The Western Climate Initiative to Reduce Greenhouse Gas Emissions

Summary:  The previous post discussed California’s greenhouse gas (GHG) reduction program mandated under its Global Warming Solutions Act of 2006.  In this post we present a description of the Western Climate Initiative (WCI).  WCI is an agreement to reduce greenhouse gas emissions encompassing seven states and four Canadian provinces extending from British Columbia to Quebec.  Its principal goal is to produce economy-wide reductions in emissions by 15% from the levels of 2005 by 2020, using a market-based cap-and-trade mechanism.  Implementation of the program is to begin in 2012, and proceed in two phases. So far, however, only two of the seven states in the U. S. have progressed toward placing the program in effect.  Prospects for the Canadian provinces may be stronger.

Introduction.  The Western Climate Initiative is a transnational collaboration of California Arizona, New Mexico, Utah, Oregon, Washington, and Montana in the U. S., and British Columbia, Manitoba, Ontario and Quebec in Canada (called “entities” in this report).  Initially the governors of California, Oregon, Washington, Arizona and New Mexico established the Western Climate Action Initiative, in February 2007.  Their agreement recognized the detrimental effects of greenhouse gas-induced warming arising from human activities, such as prolonged droughts, excessive heat waves, reduced snow packs, altered precipitation patterns and more severe wild fires.  The initiative agreed that interstate collaboration was needed, and supported market-based policies to reduce GHG emissions as a cost-effective mechanism to so.

Goals of the WCI include reducing emissions of greenhouse gases that lead to global warming, developing alternative industries that provide new economic activities while also combating global warming, and minimizing the risks associated with adverse effects of global warming such as mentioned above. Importantly, it was undertaken in recognition of the failure of substantive action on climate change at the federal level. 

Greenhouse gases covered in WCI are carbon dioxide, CO2, as well as other gases.  The heat-trapping ability of CO2 on a molecule-for-molecule basis is relatively weak; its overwhelming importance is due to the massive amounts emitted by burning the large amounts of fossil fuels used in the world economy.  Methane or natural gas, when not burned as a fuel, escapes into the atmosphere from many sources; molecule-for-molecule methane is about 25 more potent in heat-trapping effectiveness than CO2.  Another gas arising from human activity, nitrous oxide (N2O), is even stronger, about 300 times more potent than CO2; other industrial gases, including sulfur hexafluoride (SF6) and a set of hydrofluorocarbons and perfluorocarbons, range as high as 23,000 times more potent than carbon dioxide molecule-for-molecule.  Thus small amounts of these gases in the atmosphere have effects that are many multiples of those of CO2.  Numerical conversions are made when reporting data for those gases into a unit called a CO2-equivalent.

The WCI Cap-and-Trade Program.  The WCI establishes a cap-and-trade program to reduce GHG emissions, with the goal of achieving reduction of 15% of the regional emission level evaluated for 2005 by 2020 (see schematic projection to 2020 in the following graphic). 


WCI GHG reduction goal for 2020 not including Manitoba, Ontario and Quebec, as of August 2007.  Source:  http://www.westernclimateinitiative.org/component/remository/func-startdown/91/

It is designed to reduce emissions produced by 90% of the economic activities of the member entities.  Since each entity is legally independent, each has to set its system up by its own laws and rules. 

Briefly, the program relies on emissions reporting, granting of “emission allowances” by each entity whose number establishes the cap, or upper limit of emissions.  Each allowance permits the owner to emit 1000 metric tons of CO2-equivalent GHGs in a year.   The allowances can be bought by or sold to (traded) to other entities in a WCI regional allowance market.  They are issued to each industrial and commercial source of GHG emissions.  The result of this market system is that it establishes a price for emitting GHG, which in essence creates a penalty for emitting.  This provides an incentive for each source to innovate in order to reduce emissions, thus reducing its costs each year.  Additionally, offsets of 5% of total emissions are allowed with external, qualified operations that draw GHGs from the atmosphere, anywhere in North America. Offsets include activities such as reforestation.

The complete formulation of the cap-and-trade system to be implemented by WCI  was released in August 2008.  It includes detailed economic modeling and reports earlier experience gained with GHG cap-and-trade regimes in California and the European Union. An updated summary of the Design Program was issued in August 2010.

Need for High-Quality Emissions Data From Rigorous Reporting.  The WCI Program relies on a rigorous, authoritative quantitative survey of GHG emissions from each entity for 2005 in order to establish its numerical emissions goal for 2020.   Ongoing surveys, and reports to the WCI administration, are to be submitted every year to ensure compliance and track progress.  In addition, these monitoring activities have to be created with an eye toward future regulatory regimes that U. S. federal and Canadian national governments, through the Environmental Protection Agency and Environment Canada, are likely to impose in the near future.

Setting Program Emissions Limits. The program proceeds in two phases.  The first, covering 2012-2014, envisions estimating emissions for 2012 that omit transportation fuels and low-volume emissions from residential and commercial fuels.  This interim limit is subjected to reductions in allowances until the second phase begins in 2015, when estimates for the omitted fuels are added in.  This total is then further reduced year-by-year to 2020.  This is shown in the following graphic.


Maintaining Competitiveness and Preventing Emissions Leakage.  In order to promote compliance with the program, WCI envisions promoting a high degree of competition to achieve cost-effective improvements in efficiency in a given economic activity or industry.  On the other hand, the program seeks to minimize “emissions leakage”.   Leakage is the avoidance of required reductions by shifting of apparent reductions in emissions to entities outside of the program that are not monitored by the program.  Those emissions would in fact increase, thus defeating the intent of the program.   One possible approach to preventing leakage is dispensing allowances without charge to those industries that are most subject to competition and that use large amounts of energy in their operations.   These operations are most likely to succumb to gaming the program.  WCI recognizes that this approach is also under consideration in the European Union, and has appeared in some U. S. congressional proposals.

Electricity Sector.  Electricity generation is uniquely distinguished by the interconnection of power plants with others outside the WCI by means of the electricity grid.  A provider of electricity in the program commonly purchases power from out-of-region generators.  The WCI program includes the emissions from such out-of-region generation in its survey of GHG emissions subject to its regulation.  In addition, voluntary development of renewable energy supplies is to be taken into account in surveys leading to granting of emission allowances.

Designing a Fair and Transparent Auction.  The WCI program envisions that an important way to distribute or reallocate emission allowances is by an auction.  Auctions will occur every three months using a single round of sealed bids in order to minimize counterproductive market manipulation of allowances.  A minimum auction price will be established which recognizes market factors at the time the auction takes place.  Auction trades will be posted for transparency and efficiency.  The market will be subject to upcoming rules that are being formulated both in the U. S. and Canada for the trading of commodities.  Kyle S. Smith, executive director for the Washington Wildlife Federation, has criticized the WCI allowance program because it has not made clear whether allowances will be free or must be purchased at the outset.  It is true that, at least for highly competitive industries, free allowances are indeed envisioned. (see above).  Security of allowances in the accounts is an important factor; news of the electronic theft of permits in the European Union in January 2011 has alerted the WCI and others to the need for protection against hacking.

Participation by Canadian Provinces.  The four provinces that have subscribed represent about 75% of Canada’s population.  As Ontario signed on to the WCI, Alberta and Saskatchewan decried the program at a meeting of provincial premiers in July 2008, calling the program a cash grab by Canada’s other provinces, which are less well off.  It has to be recognized that Alberta is the site of the massive crude oil production industry based on extraction from tar sands.  This mode of production requires far more fossil fuel input for extraction than does conventional oil production from wells drawing on deep geological reservoirs.  Alberta is responsible for the most GHG emissions of all the Canadian provinces.

Implementation in the U. S.  At the time of writing, only California and New Mexico, of the seven states participating in WCI, are on track to implement the accord.  In the November 2010 elections, California’s voters rejected a referendum initiative that would have ended implementation of California’s Global Warming Solutions Act (see the earlier post).  

New Mexico has issued rules to implement the program.  However, the new governor elected in November 2010, Republican Susana Martinez, is opposed to the program.  Earlier, in 2009, a committee of the state’s legislature failed to approve legislation to authorize carbon trading.  Furthermore, the state’s implementing rules may be challenged in court, and the new regulatory board to be appointed by Gov. Martinez may revoke the rules.  Oregon and Washington, even though generally pro-environment in outlook, have not developed rules for implementation, at least partly because of the difficult economic environment the U. S. is currently experiencing.

In February 2010 the Republican governor of Arizona, Jan Brewer, withdrew the state from the WCI.  This action is part of a statewide review of policies directed toward combating climate change.  Officials are concerned about the effect of the WCI on Arizona’s economic recovery.  The state legislature is strongly opposed to the cap-and-trade mechanism of the WCI, which requires legislation to place it in force.

Commentary on the program from Canadian bloggers appears more supportive of participation by Canada’s provinces than is the atmosphere in the U. S.   Some note the need for preserving, indeed strengthening, the limitations on GHG emissions in the WCI program.

Conclusion.  The California Global Warming Solutions Act of 2006 provides policies for reducing GHG emissions that fall within the WCI program.  As noted above, however, the political climate is an extremely difficult one for full implementation of the program elsewhere; so far in the U. S. only California and New Mexico have advanced toward its goals, while Arizona has dissociated itself from the initiative.  At the federal level in the U. S., strong opposition from the energy industry has influenced lawmakers, and the Congress has not passed legislation that limits GHG emissions.  As a result, an inefficient, variegated pattern of state and regional programs is coming into being. 

Passage of a single national energy policy directed to minimizing greenhouse gas emissions, leading hopefully to a stabilization of atmospheric greenhouse gas levels, would be far more preferable for economic and environmental policy on the national level, as well as on the international stage.  At the national level, a unified approach would help establish new industries and job opportunities, and relieve the U. S. from its critical dependence on foreign sources of fossil fuels. Ultimately, since this is a global problem, it requires a global approach.  Sound, concerted national policy by the U. S. and Canada would benefit all concerned interests.

© 2011 Henry Auer

Wednesday, January 12, 2011

California’s Global Warming Solutions Act: Bold Action on Greenhouse Gases

Summary:  California’s Global Warming Solutions Act of 2006 represents an ambitious initiative to curtail emissions of global warming gases by the state in the U. S. having the largest economy.  The Act is especially significant in the present political environment, since the U. S. Congress has been unable to pass any legislation regulating emissions of greenhouse gases that exacerbate global warming.  It establishes the level of greenhouse gas emissions that occurred in 1990 as the goal, and mandates reducing the use of fossil fuels sufficiently to attain that level by the year 2020, a 15% decrease.  Implementation of the Act is exceptionally broad, affecting the greenhouse gas emissions of practically all aspects of California’s economy.

Introduction. A previous post on this blog reported that California voted to maintain in effect the state’s Global Warming Solutions Act of 2006 in a November 2010 referendum.  A notable feature of this law is recognition  that “national and international actions are necessary to fully address the issue of global warming. However, action taken by California to reduce emissions of greenhouse gases will have far-reaching effects by encouraging other states, the federal government, and other countries to act.” (Chapter 2, section (d)).  California thus recognizes that many countries of the world, including the U. S. federal government, have failed for more than one decade to act decisively to curb greenhouse gas emissions and the resulting detrimental effects of worldwide global warming. 

The Global Warming Solutions Act.  In more detail, the Global Warming Solutions Act requires in part
(1)  complete and verifiable monitoring and annual reporting of all major sources of greenhouse gas emissions in the state;
(2)  accounting for greenhouse gas emissions arising in particular from the generation of electricity used in the state, whether generated within or outside the state;
(3)  establishing the level of greenhouse gas emissions that occurred in 1990 by January 1, 2008, and developing regulations to assure that greenhouse gas emissions be lowered to that level by 2020;
(4)  by January 1, 2011 adopting a greenhouse gas emission limit, as well as  measures to reduce emissions sufficiently to achieve that limit by 2020, by establishing regulations by January 1, 2012; the measures set up taking into account technological feasibility and cost-effectiveness in order to achieve the Act’s objectives, for electricity generation, petroleum refining and fuel supplies, subject to exclusions for small businesses whose emissions fall below a level to be determined; and
(5)  affording the option of adopting regulations that establish a market-based system with successively lower annual limits to greenhouse gas emissions in order to achieve the objectives of the Act.

The state Air Resources Board is mandated to implement the Act.  Current progress and the status of implementing the Act may be accessed here.  It’s generally understood that a market-based system in item (5) will be a cap-and-trade market mechanism, in which successively lower maximum limits for emissions are established periodically, and rights to emit those levels are traded on an open market.

Climate Change Scoping Plan. Under the requirements of the Act, the Air Resources Board issued its final Climate Change Scoping Plan in December 2008.  The Executive Summary notes that reductions of greenhouse gas emissions by the mandated amount of 15% of present levels to achieve 1990 levels by 2020 would actually correspond to a reduction of 30% of the level of emissions envisioned for 2020 if emissions growth would proceed until then according “business-as-usual”. 

Although the Act extends only to 2020, an Executive Order mandates a further reduction from the levels of 1990 by 80%, to be achieved by 2050.  The Scoping Plan envisions the bold, innovative initiatives required to meet this extended objective:

“Reducing our greenhouse gas emissions by 80 percent will require California to develop new technologies that dramatically reduce dependence on fossil fuels, and shift into a landscape of new ideas, clean energy, and green technology. The measures and approaches in this plan are designed to accelerate this necessary transition, promote the rapid development of a cleaner, low carbon economy, create vibrant livable communities, and improve the ways we travel and move goods throughout the state. This transition will require close coordination of California’s climate change and energy policies, and represents a concerted and deliberate shift away from fossil fuels toward a more secure and sustainable future. This is the firm commitment that California is making to the world, to its children and to future generations.”

As mentioned above, the Scoping Plan’s objectives for 2020 include expanding existing energy efficiency programs already in place prior to enactment of the Act, including residential and appliance standards; achieving use of renewable sources for electricity generation to one third of the total; a state-wide, economy-wide cap-and-trade program; lowering transportation-derived emissions including California’s existing clean car mandate and a Low Carbon Fuel Standard; and setting up a fee structure for various activities including use of manmade industrial chemicals having high global warming potential.

The Scoping Plan discusses most areas of California’s economic activity, which in addition to those just mentioned include lowering transportation-related greenhouse gases, a “million solar roofs” program, addressing medium- and heavy-duty vehicles, a high speed rail system in the state, environmental standards in construction, and agriculture.

Carbon Emissions Allowances.  Most recently, on December 16, 2010 the Air Resources Board released the regulations for California’s emissions trading program (see the news release), using a cap-and-trade regime. According to the news release, 80% of California’s greenhouse gas emissions are limited by the program.  The program is complemented by California’s initiatives in standards for energy-efficient vehicles, low-carbon fuel standards, and energy efficiency programs.

The regulation extends to 360 businesses representing 600 facilities.  It will unfold in two broad phases: the first, beginning in 2012, includes all major industrial sources along with utilities; and, a second phase that starts in 2015 and brings in distributors of transportation fuels, natural gas and other fuels. Initially over 2012-2014, allowances, each covering the equivalent of one ton of carbon dioxide emissions, are free to industrial sources.  Companies needing more may purchase them at state-run auctions.  For the electricity generation industry, allowances are also granted, and must be sold with the proceeds assigned to the benefit of ratepayers and used to promote the reduction objectives of the Act.  In subsequent years fewer allowances are distributed so that sources have incentives to optimize their operations to reduce emissions of greenhouse gases.  Compared to the present, by 2020 California should have lowered overall emissions by 15%. 

In addition to direct reduction of allowances leading to reductions in emissions, entities may also offset up to 8% of its emissions by purchasing allowances from state-qualified offset programs.  These programs include reforestation and forest development, dairy industry methane reductions (methane is powerful greenhouse gas), and destruction of ozone-depleting refrigerants under an older worldwide agreement.  California has already put in place contractual agreements with two tropical forest locales to participate in offsets.

California’s Important Role in Reducing Greenhouse Gas Emissions.  With an economy that represents about 17% of all the United States, California plays an exceptional role in any efforts to lessen the effects of global warming.  Implementation of its Global Warming Solutions Act with its interim goal set for 2020, and with the additional policy goal set for 2050, places California at the forefront of non-federal actions to reduce global warming arising from manmade greenhouse gases.  Some other states and regions in the U. S. have analogous programs in place with varying levels of goals to achieve.  California’s program, together with those of the other states, demonstrates what can be achieved by dedicated assertion of forward-looking programs.  These necessarily take into account the economic effects of the changing energy landscape that these efforts entail.  They clearly demonstrate that economic factors no longer provide a viable reason by which some people oppose greenhouse gas reduction programs.

Conclusion. Nevertheless, with several different plans arising across the country, energy policy is developing into a checkerboard on the regulatory and economic landscape.  Enactment of a single national energy policy directed to minimizing greenhouse gas emissions, leading hopefully to a stabilization of atmospheric greenhouse gas levels, would be far more preferable for economic policy on the national level, as well as working toward an important environmental objective nationally and on the international stage.  Ultimately, since this is a global problem, it requires a global approach.  Sound, concerted national policy by the U. S. would benefit all concerned interests.

© 2011 Henry Auer

Wednesday, January 5, 2011

Greenhouse Gas Emissions by The United States: Past Growth and Future Trends

Summary:  Our planet is struggling to limit the growth in atmospheric greenhouse gases  arising from burning of fossil fuels over the last 150 years.  The increased amounts of greenhouse gases are thought to be responsible for global warming. 

In this post we characterize the use of energy in the United States, most of which is generated from the burning of fossil fuels that produce greenhouse gases.  A companion analysis for China was presented in the preceding post.

Projections of future energy demand and its production, both in the U. S. and worldwide, predict increased annual emissions of greenhouse gases, leading to rising accumulation of these gases in the atmosphere.  This predicted growth, in conjunction with other recent studies of greenhouse gas emissions, leads to a conclusion that limiting production of greenhouse gases is of the utmost and immediate importance.

Introduction.  The United States, as the developed country with the largest population and the most vigorous economy of the world, has consumed a large fraction of the world’s energy for the last few decades.  In this post a breakdown of recent and current consumption patterns for the major sources of energy in the U. S. is presented.  Then a projection of future trends for the next 25 years is provided.

Essentially all the information below was obtained from the U. S. Energy Information Agency (USEIA), an office within the Department of Energy.

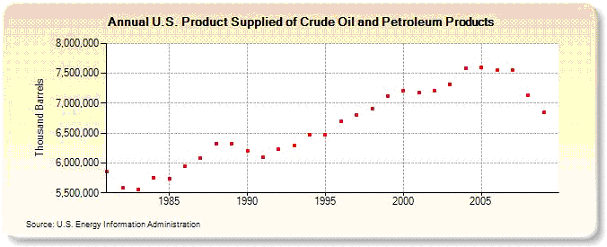
Petroleum. U. S. domestic production of crude oil peaked in 1970.  In 2009 the U. S. imported approximately 4,250 million barrels of oil, and produced just under 2,000 million barrels, or about 32% of the total used.  The graphic below shows the total consumption of crude oil (“product supplied”) from 1980 to 2009, in thousands of millions (billions) of barrels of oil.


Source: USEIA. http://www.eia.gov/dnav/pet/hist/LeafHandler.ashx?n=pet&s=mttupus1&f=a

The trends for total oil consumed, as for other fossil fuels, decreased during 2008-9 due to economic adversity and lower weather-related demand  Late in 2010, the USEIA projected that for all of 2010 total consumption of crude oil and liquid fuels increased to about 6,968,000 thousand barrels, representing an increase of about 1.7% over 2009. 

Natural Gas. Total consumption of natural gas since 1949 is shown in the graphic below.  After a period of dramatic growth ending about 1972, consumption fell over the following decade, and has increased to levels that stayed approximately constant since 2000. 

            Source: USEIA.  http://www.eia.gov/dnav/ng/hist/n9140us2A.htm


Data for 1999-2009 is expanded in the graphic below, with additional projections of usage (blue line, left hand scale), and yearly percent changes (red bars, right hand scale), for 2010 and 2011.


                  Source: USEIA.  http://www.eia.gov/emeu/steo/pub/gifs/Fig17.gif

Over the years improvements in home construction and the efficiency of major appliances have resulted in significant drops in residential consumption of natural gas. After accounting for variations in weather, residential consumption on a per customer basis over the 19-year period from 1990 to 2009 fell by 22 percent.

The decrease in total gas consumption for 2009, and the subsequent increase for 2010, are attributed to the effects of the weakened economy and its rebound in those two years, as well as to weather conditions that weakened demand. For example, the U. S. Federal Reserve Board has determined that capacity utilization in the nation’s factories was 70.4% in 2009, down from 77.5% in 2008.

According to the USEIA, use of natural gas in the generation of electricity has grown widely in the past two decades, at the expense of coal.  In 2009, natural gas made up almost 24 percent of net power generation in the U. S, whereas in 1996, natural gas made up only 14 percent.  In contrast, over this interval use of coal for power generation fell from 50 percent in 1995 to 45 percent in 2009.

U.S. Coal Production and Usage.  The graphic below shows the long term production (red line) and consumption (broken green line) of coal in the U. S. since 1949.  The difference between these lines is reflected in net exports (black line).  It is seen that over the period shown coal use has more than doubled.  


The decline in coal consumption during 2009 was the consequence of the domestic economic conditions combined with the weather during the year, which resulted in lower demand for electricity (see below).  Consumption of coal for the first 6 months of 2010 increased slightly.  Consumption of coal in 2010 was predicted to grow by 1 percent (see the following graphic). USEIA projects that coal production in 2011 will remain relatively flat.

   Source: USEIA. http://www.eia.doe.gov/cneaf/coal/quarterly/html/t32p01p1.html

The electric power sector, which consumes about 94 percent of U. S. coal, is the overriding factor determining total domestic coal consumption. In 2009, the recession’s downward pressure on electricity production resulted in a large decrease in coal consumption for the sector.
Electricity. Explanation of Units. The watt is a unit of power, i.e., the rate of producing or using energy in a standard period of time.  When watts are multiplied by the time elapsed, we get the total amount of energy produced or consumed; in electricity jargon this energy unit is a watt-hour, or W-h.  More convenient amounts of power generation are measured in thousands of watts, or kilowatts (kW), and billions of watts, or gigawatts (GW).  The total amount of energy produced or used over a period of time, is expressed in thousands of W-h, or kilowatt-hours,(kW-h, on a household scale), or in millions or billions of kW-h (on an industrial scale or higher).

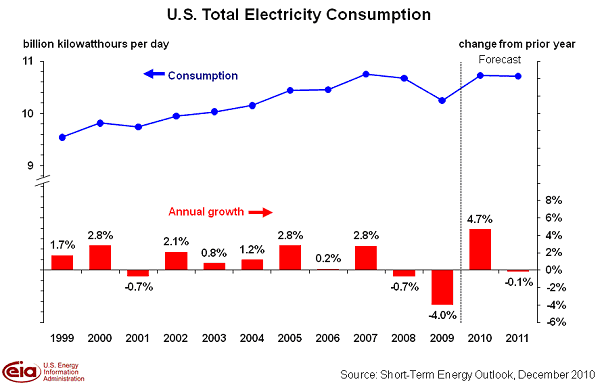
U.S. Electricity Consumption. The national overall consumption of electrical energy recorded between 1999 and 2009, and predicted for 2010 and 2011, is shown by the upper blue line in the graphic below, in billions of kW-h per day. (In order to compare this with a similar graphic in the previous post on China, which shows electrical energy for entire years, the “9”, “10” and “11” on the left-hand y-axis below would be “3,285”, 3,650” and “4,015”, respectively.) 

               Source: USEIA. http://www.eia.gov/emeu/steo/pub/gifs/Fig22.gif

As seen for the forecast years to the right of the vertical line, the  USEIA expects U.S. electricity consumption will rise by 4.7 % in 2010 (see the above graphic, the lower red bars with the scale along the right-hand y-axis). For 2011, U.S. consumption of electricity is predicted to grow by only 0.2%, as increased usage in the industrial sector is offset by decreased predicted use in residential energy.

By far the largest consumer of coal in the U. S. is the electrical generation industry.  USEIA forecast that coal consumption by this sector would grow by 5.7 percent in 2010, but would decline by 0.2 percent in 2011.        

In contrast, it was foreseen that generation from non-fossil-fuel-fired sources would increase, and that natural gas-fired generation would also decline. Increases in the proportion of electricity provided by nuclear energy and hydroelectric power are offset by a comparable decrease in coal-fired generation.

Renewable Energy.  The sources for all forms of energy consumed in the U. S. during the years 2004-2008 are shown in the table below.  The numbers are in units of quadrillion British Thermal Units (Btu’s), where 1 quadrillion = 1 million billion, or “1” followed by 15 zeroes.  In the table, purely by chance, the totals for all years across the top row are accidentally very close to 100, so that all the entries below the top line can be usefully interpreted as percents.


Before discussing the renewables, it should be noted from the table that total energy usage in the U. S. remains remarkably constant in the five years shown.  Likewise, the major components of this energy consumption, total fossil fuels, nuclear electric power and conventional hydroelectric power, remain essentially unchanged in this period. 

Changing trends are seen only for renewable energy, which increases from about 6.2% in 2004 to about 7.4% in 2008.  Most of this increase in consumption occurs in biomass (this includes biofuels such as ethanol), and wind energy, which increases dramatically from about 0.1% in 2004 to about 0.5% in 2008.  Even so, while these increasing trends are significant, they still make very small contributions to the overall sourcing of the U. S. national energy mix.  It is also significant that solar, which includes both focused thermal and photovoltaic electricity installations, constitutes a miniscule portion of the overall energy sourcing, even though it grew from about 0.07% in 2004 to about 0.1% in 2008. 

The fractional breakdown of sourcing in 2008 is presented in the pie chart below.  Please note that the percents shown on the right for renewable energy are the percents of the 7% renewable sector, totaling 7.367 quadrillion Btu. 


Renewable Energy Consumption in the Nation's Energy Supply, 2008.  Source: U.S. Energy Information Administration, Office of Coal, Nuclear, Electric and Alternate Fuels    http://www.eia.doe.gov/cneaf/solar.renewables/page/trends/highlight1.html


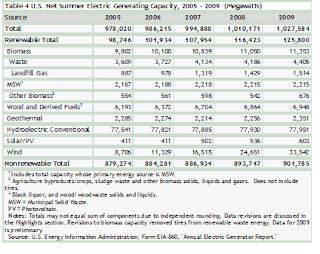
The table below emphasizes renewable generating capacity in the U. S. between 2005 and 2009 (second line).  The table shows that virtually all the increase in renewables arises from additional wind generation capacity (next–to-last line), which grew from 9,000 MW to 33,500 MW.


Source: USEIA.   http://www.eia.doe.gov/cneaf/solar.renewables/page/table4.html 

CO2 and Greenhouse Gas Emissions: Past, Present and Future. Carbon dioxide (CO2) is the most important greenhouse gas because of the overwhelmingly large amount produced by the burning of fossil fuels.  In terms of the useful amount of heat energy obtained per carbon atom upon burning, coal is the weakest, liquid fuels such as gasoline and diesel are higher, and natural gas (mainly methane) is much higher. 

The heat-trapping ability of CO2 on a molecule-for-molecule basis, however, is relatively weak; its overwhelming importance is due to the massive amounts emitted by burning the large amounts of fossil fuels used in the world economy.  Methane or natural gas, when not burned as a fuel, escapes into the atmosphere from many sources; molecule-for-molecule methane is about 25 more potent in heat-trapping effectiveness than CO2.  Another gas arising from human activity, nitrous oxide (N2O), is even stronger, about 300 times more potent than CO2; other industrial gases, including sulfur hexafluoride (SF6) and a set of hydrofluorocarbons and perfluorocarbons, range as high as 23,000 times more potent than carbon dioxide molecule-for-molecule.  Thus small amounts of these gases in the atmosphere have effects that are many multiples of those of CO2.  Numerical conversions are made when reporting data for those gases into a unit called a CO2-equivalent.

Atmospheric emissions of all greenhouse gases, reported as CO2-equivalents, are shown in the table below for 1990, 1995 and the years from 2000 to 2008.  As noted in earlier sections, 2008 represents the depth of the economic recession in the U. S.; burning of fossil fuels continued to increase in 2009 and 2010.


Source: USEIA. http://www.eia.doe.gov/oiaf/1605/ggrpt/index.html.  High-GWP Gases refers to high global warming potential gases given by footnote a.


A proportional pie chart of the data for 2008 is shown below.

               Source: USEIA. http://www.eia.doe.gov/oiaf/1605/ggrpt/index.html.

USEIA expects fossil-fuel CO2 emissions to increase by 3.9 percent in 2010, and to remain more or less unchanged during 2011.  These fossil-fuel-based emissions are predicted to remain below levels experienced during the period 1999 through 2008.

The end-use distribution of emissions for only CO2, excluding other greenhouse gases, is shown in the following pie chart.

          Source: USEIA. http://www.eia.doe.gov/oiaf/1605/ggrpt/index.html#total .


An important measure for the global warming effects of greenhouse gas emissions is the carbon intensity.  This is a measure of how much CO2 and equivalents are emitted into the atmosphere for each unit of economic activity as measured by a nation’s gross domestic product (GDP).  The following table gives the carbon intensity for the U. S. for the years 1990, 1995 and 2000-2008.  It is seen that

U.S. Greenhouse Gas Intensity and Related Factors, 1990 to 2008

   Year
1990
1995
2000
2001
2002

Greenhouse Gas Intensity (MTCO2e per Million 2005 Dollars)
770.2
717.2
624.4
607.0
601.9


   Year
2003
2004
2005
2006
2007
2008
Greenhouse Gas Intensity (MTCO2e per Million 2005 Dollars)
592.5
583.2
568.3
547.2
544.0
529.8


the carbon intensity decreases significantly over this period.  This reflects not only increased productivity in turning out goods per unit of economic activity, but also greater efficiencies in residential energy use and a shift in the economy away from energy-intensive activities and toward less intense service industries.

The USEIA posted its Early Release Overview http://www.eia.gov/forecasts/aeo/  of the Annual Energy Outlook 2011 for the U. S. in December 2010.  It includes the following prediction of total U. S. CO2 emissions up to 2035.  Such predictions are sensitive to assumed effects of current policies and private sector decisions including those based on anticipated price trends  

        Source: USEIA AEO2011 Early Release Overview http://www.eia.gov/forecasts/aeo/


on consumption of fossil fuels leading to CO2 emissions.  These assumptions form the basis of the Reference case in this prediction (see title of graphic).

The historical and projected distribution of fuel types that provide energy for the U. S. is shown in the following graphic, between 1980 and 2035.  Overall energy use characterized as Btu’s consumed (converting electrical energy to the Btu

Source: USEIA AEO2011 Early Release Overview http://www.eia.gov/forecasts/aeo/

equivalent) increases over the forecast period.  Of the classes shown, renewables, liquid biofuels and nuclear energy do not produce significant net CO2 emissions.  The remaining classes correlate with the low rate of increase of predicted CO2 emissions shown in the preceding graphic, above.  It is encouraging, from the point of view of predicted greenhouse gas emissions, that essentially all the projected growth occurs in the fuel classes that do not emit CO2, namely, renewables and liquid biofuels.

Worldwide energy use and greenhouse gas production. Over the past decades, the countries of the developed world have had relatively stable rates of low increases in energy use and emission of greenhouse gases, as their economies are already mature and their rate of growth of population is low.  In contrast, the developing countries of the world have been growing rapidly, as more of their populations become urbanized or otherwise energy-dependent; in addition the populations in many of these countries have grown rapidly.  This economic growth has been fueled by correspondingly increasing rates of fossil fuel-derived energy and emission of greenhouse gases.  These trends are illustrated in the following graphic, showing the U. S. and China, and

                                 Sources: USEIA including its AEO2009.    
                   http://www.eia.doe.gov/oiaf/1605/ggrpt/index.html#total


the Organization for Economic Cooperation and Development (OECD) and non-OECD countries of the world.  The OECD is an organization of 34 countries with advanced or relatively mature economies.  These include the U. S., most European countries, and Japan, Korea, Australia and New Zealand in Asia.  China and most Latin American countries are not part of OECD.  Importantly, the non-OECD group also includes rapidly growing countries such as India and Brazil.

The graphic above shows that while the U. S. (pale green) and OECD generally (dark blue-green) have produced and are predicted to produce modestly increasing amounts of CO2, China (light purple) and the rest of the non-OECD countries (brown) have been, and will continue, emitting multiplied amounts of CO2 over the years.  The USEIA International Energy Annual 2006 reports http://www.eia.doe.gov/oiaf/1605/ggrpt/index.html#total that OECD as a whole, is predicted to have a 0.2% average annualized rate of growth of CO2 emissions between 2006 and 2030, which is responsible for 7.2% of the increase in actual tonnage of CO2 emissions.  The corresponding numbers for non-OECD nations of the world are 2.2% average annualized rate of growth of CO2 emissions, which is responsible for 92.8% of the actual increase in tonnage of CO2 emissions.  (Follow the link for more detailed data and analysis.)

Atmospheric Greenhouse Gases Continue to Increase in Coming Decades.  The graphic above and the data just cited present the stark prospect envisioned for at least the next two decades that in each year worldwide emissions of greenhouse gases get larger and larger.  This means that, since most emitted greenhouse gases are not removed from the atmosphere, they keep on accumulating year after year, building up a stronger greenhouse effect with each passing year.  In an earlier post, the atmosphere was likened in a simplified way to a bathtub containing an atmosphere with CO2.  As the faucet adds more CO2, the CO2 level in the bathtub keeps rising since the drain is shut.

In other posts, the World Energy Outlook (WEO) 2010 published by the International Energy Agency, and an article by Davis and coworkers with a commentary by Hoffert have stressed the very dire situation that we will actually face in the future.  Recent predictions of future global warming from the United Kingdom and the United Nations suggest that average global temperatures could rise 4 deg C (7 deg F) or more from today by the end of the century.  These and other reports emphasize the immediate need to undertake major, drastic efforts to cut back on global greenhouse gas emissions, and to install renewable and sustainable energy sources as soon as possible.

© 2011 Henry Auer