See the Tabbed Pages for links to video tutorials, and a linked list of post titles grouped by topic.

This blog is expressly directed to readers who do not have strong training or backgrounds in science, with the intent of helping them grasp the underpinnings of this important issue. I'm going to present an ongoing series of posts that will develop various aspects of the science of global warming, its causes and possible methods for minimizing its advance and overcoming at least partially its detrimental effects.

Each post will begin with a capsule summary. It will then proceed with captioned sections to amplify and justify the statements and conclusions of the summary. I'll present images and tables where helpful to develop a point, since "a picture is worth a thousand words".

Thursday, June 30, 2011

Public Attitudes on Global Warming and Their Political Ramifications

Summary.  A survey of Americans in spring 2011 shows that almost 40% are grouped as Alarmed or Concerned about global warming. Many of them understand that greenhouse gases arising from burning fossil fuels are responsible for global warming.  10% of respondents are Dismissive of global warming, so that they feel that human activity is not responsible for it.  Those surveyed understand that many remedial actions can be taken to reduce greenhouse gas emissions.  The personal attitudes reflected in the survey results are mirrored in the way people identify with the political parties active in the U. S.

Introduction.  In the United States, political action to establish a framework addressing global warming under law has so far not been possible.  In spite of persistent efforts by environmental groups supporting an environmental policy law, other interests have opposed this effort, seeking to weaken or defeat proposed legislation. 

In such a polarized political environment, it is important to understand the opinions of the public on this issue.  This post presents the results of a survey of Americans on the topic of global warming.  A. Leiserowitz and his collaborators at Yale and George Mason Universities have been conducting public opinion surveys on questions of global warming and energy policy for several years.  Their previous survey was discussed in a post on this site in March 2011.  Selected results of their latest surveys, released within the past month, are summarized here.

Six Classes of Response to Global Warming Among Americans.  Leiserowitz and coworkers classified Americans into six groups in 2008, based on their attitudes concerning global warming and a need, if any was perceived, to address this issue.  They term these groups the “Six Americas”.

Alarmed Americans fully accept that global warming is real and carries serious consequences.  They already take measures to address it.
Concerned people likewise are convinced of the reality of global warming and its significance, but have not personally engaged in combating it.
Cautious members of the nation, while understanding that global warming may be a problem, are not convinced it is occurring, and do not feel a need to engage the issue.
Disengaged Americans do not give serious thought to global warming and indicate a lack of knowledge about the issue. 
Doubtful people are divided among those who believe it is occurring, those who feel it is not, and others who do not have an opinion.  Many believe global warming, if in fact it is occurring, arises from natural rather than man-made causes.  They also believe its effects are not a hazard to humanity.
Dismissive Americans feel that global warming is not happening, and that the issue does not raise a threat to humanity or life on earth.  They strongly feel no action to combat global warming is needed.

A Survey of Public Opinion on Climate Change.  Leiserowitz and coworkers (see Note 1 below) conducted a detailed survey of 981 American adults in the spring of 2011. 

Using the groups above that they already characterized, Leiserowitz and coworkers classify Americans in six classes of belief on global warming as shown in the graphic below.  39% are grouped as Alarmed or Concerned.  50% are


classed as Cautious, Disengaged or Doubtful, indicating an absence of a strong feeling about global warming and humanity’s role in its origins.  10% are Dismissive. (It is presumed that rounding errors lead to the total being less than 100%.)

The overall level of concern and feeling that action is needed among Americans follows their classification among the six groups; this has not changed significantly over three years (see the graphic below).

Certainty that Global Warming is Occurring, by Group and Date Surveyed
Certainty about the reality of global warming was measured on a 9-point scale, where 9 = extremely sure that global warming is occurring; 8 = very sure that global warming is occurring; 7 = somewhat sure that global warming is occurring; 6 = not at all sure that global warming is occurring; 5 = don't know;  4 = not at all sure that global warming is not occurring; 3 = somewhat sure that global warming is not occurring; 2 = very sure that global warming is not occurring; and 1 = extremely sure that global warming is not occurring.  For each class, points for surveys taken November 2008, January 2010, June 2010 and May 2011 are graphed.


Cause of Global Warming.  Three-fourths of Americans in the Alarmed and Concerned groups believe global warming arises from human activities.  On the other hand, among the Doubtful and Dismissive groups, 85% believe it has natural origins or is not happening at all.  Overall, 47% of all Americans believe global warming is caused by man, and 36% believe it is caused by natural changes in the environment.

Effects of Global Warming.  Americans believe global warming will affect people in other parts of the world, and people in future generations, as opposed to affecting Americans at the present time.  Believing in high levels of risk is very prevalent among the Alarmed and Concerned groups, and is absent (0%) among Dismissives.

Impacts in the U. S.  About one-half of Americans think that global warming is already worsening environmental effects in the U. S., causing coastline erosion, flooding, drought, and hurricanes.  A majority believe global warming will increase deaths and injuries in the future from such events as floods, hurricanes, winter storms and wildfires.

Support for Global Warming Policies Among Americans.  In a related survey of 1,010 Americans by Leiserowitz and coworkers in the spring of 2011, opinions on various possible policy initiatives were assessed (see Note 2), without paying attention to the six classes which were the focus of the Six Americas survey.

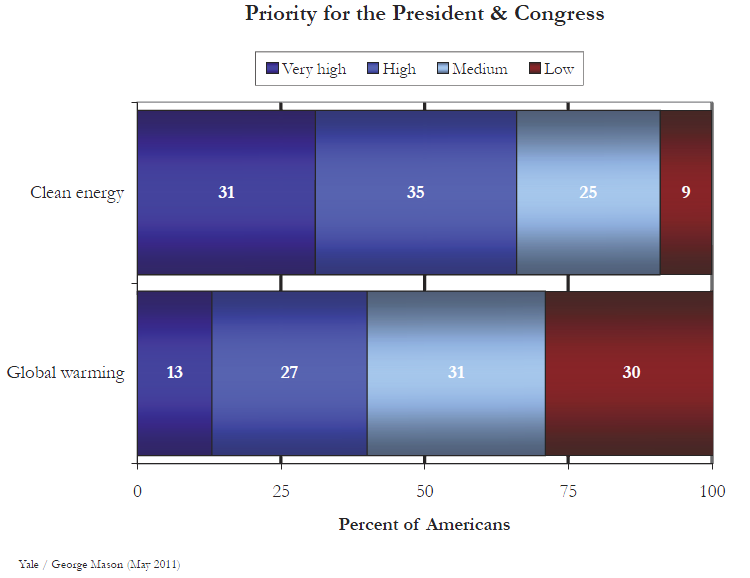
Priorities for the President and Congress.  The survey asked respondents whether they think developing sources of clean energy should be a low, medium, high, or very high priority for the president and Congress, and whether they think that global warming should be a low, medium, high, or very high priority for the president and Congress.  The results, shown in the graphic below, indicate that over 90% of surveyed Americans believe that clean energy is at least a medium priority (31% favoring a very high priority),


Source: Leiserowitz and coworkers.

and that over 70% of respondents think global warming should be at least a medium priority (13% favoring a very high priority).

Who in Public Life Should Act to Address Global Warming?  The survey asked which segments in the American economic and political world should be called upon to take measures to address global warming, and by how much.  Respondents could choose among the possibilities of “Much more”, “More”, “Currently doing the right amount”, “Less”, and “Much less”.  The results are shown in the graphic below.

Source: Leiserowitz and coworkers.

Outside of governmental agents, respondents felt that corporations and industry, and citizens themselves, are the groups that hold the greatest responsibility for taking action, independent of government intervention.  For  these two groups, at least 63% of respondents felt they should engage in more, or much more, action.  From 57% down to 52% of respondents felt that, in turn, the U. S. Congress, the President, state governors, state legislators, and local government officials, should undertake more or much more initiatives to address global warming. 

More than three-quarters of respondents felt that it was somewhat, very, or extremely important to protect against the harmful effects of global warming on the water supply, the public’s health, agriculture, forests, wildlife, coastlines, sewer systems, and public property.

Political Party Affiliations and Policy.  Depending on the question asked, the policy positions differ sharply, depending on the political party that respondents subscribe to.  Democrats (more liberal), Independents, and Republicans (more conservative) have diminishing sense of priority for global warming as an issue (see the graphic below).

Source: Leiserowitz and coworkers.


On the other hand, all three party affiliations reflect a much higher priority for promoting clean energy (see the graphic below).

Source: Leiserowitz and coworkers.


At least 85% of respondents in all three party affiliations confer a medium, high, or very high priority on promoting clean energy.  To this reporter, on a practical level, this preference for favoring clean energy policies while (for Independents and Republicans) partly opposing policies to address global warming is inconsistent.  By and large, the actual policies and practices that successfully lead to developing a clean energy economy likewise lead to combating the emission of greenhouse gases that produce global warming.  Thus favoring clean energy policies should also lead respondents to favor policies that combat global warming.

This observation is consistent with a consideration of detailed questions in the survey on practices that might be implemented, some of which are presented below.  In many of the cases, there is moderate to strong support for the policy regardless of political persuasion.  Those who support these policy measures across the political spectrum should equally favor clean energy and fighting global warming.  (For other specific policy suggestions, however, differences based on political party still remain.)

How much do you support or oppose requiring electric utilities to produce at least 20% of their electricity from wind, solar, or other renewable energy sources, even if it cost the average household an extra $100 a year?  (Here 42% of Republicans somewhat or strongly oppose the policy.)
How much do you support or oppose signing an international treaty that requires the United States to cut its emissions of carbon dioxide 90% by the year 2050? (Here Independents and Republicans show significant opposition to the treaty.)
How much do you support or oppose funding more research into renewable energy sources, such as solar and wind power?
How much do you support or oppose providing tax rebates for people who purchase energy efficient vehicles or solar panels?
How much do you support or oppose increasing taxes on gasoline by 25 cents per gallon and returning the revenues to taxpayers by reducing the federal income tax?  (Strong to very strong opposition to this policy across all parties.)
How much do you support or oppose paying 5% more on your monthly utility bill to get your electricity from renewable energy sources, like wind or solar?
How much do you support or oppose regulations requiring any new home to be more energy efficient. This would increase the initial cost by about $7,500, but save about $17,000 in utility bills over 30 years?

Conclusions.  On the basis of survey results Leiserowitz and coworkers classify Americans into six groups based on their concern, or lack of concern, about global warming. 39% are grouped as Alarmed or Concerned about global warming, believing that global warming is happening and that human activity is responsible.  At the other extreme, 10% are Dismissive, claiming that global warming does not exist, and that no action needs to be taken to address it.

In a related survey, Leiserowitz and coworkers find that a large majority of Americans feel that developing clean energy is a priority for our national leaders, but that global warming is less so.  More than 60% of respondents believe corporate and industrial entities, as well as private citizens, should address global warming; a slightly lower proportion believe that government officials should do so.

When classed according to political party affiliation, Americans differ widely when asked to consider global warming as an issue, with 50% of Republicans (more conservative) giving global warming a low priority as an issue.  If described as promoting clean energy, however, the difference between parties largely disappears.

Thus it appears that attitudes about global warming, and about policies that might relieve some of its harmful effects, are driven by considerations other than the scientific basis that underlies the issue.  This possible complication interferes with the need to develop a strong national policy dealing with global warming and energy policy.

                             ==================================

Note 1. Leiserowitz, A., Maibach, E., Roser-Renouf, C. & Smith, N. (2011) Global Warming’s Six Americas, May 2011. Yale University and George Mason University.  New Haven, CT: Yale Project on Climate Change Communication.  http://environment.yale.edu/climate/files/SixAmericasMay2011.pdf.

Note 2. Leiserowitz, A., Maibach, E., Roser-Renouf, C. & Smith, N. (2011) Climate change in the American Mind: Public support for climate & energy policies in May 2011. Yale University and George Mason University. New Haven, CT: Yale Project on Climate Change Communication. http://environment.yale.edu/climate/files/PolicySupportMay2011.pdf.


© 2011 Henry Auer

Friday, June 17, 2011

Economic Costs of Extreme Weather Events Due to Global Warming

Labels. global warming,climate change,greenhouse gases,carbon dioxide,CO2, extreme weather,heat wave,drought,flooding,Pakistani floods,Russian wheat,crop loss,wildfires,bark beetles,economic costs,econometrics

Summary.  Global warming is predicted to increase the probability of extreme weather events that have the potential of harming human livelihood.  This post summarizes three extreme events whose occurrence is consistent with predicted effects of global warming: the massive flooding in Pakistan in 2010, the severe drought and failure of the wheat crop in Russia in 2010, and increased numbers and severity of wildfires in recent years in the American west.  Each of these is associated with very large economic and societal costs.  To date we have paid these costs only in a reaction to the event, after the fact.  An alternative strategy is to invest in measures, and undertake policies, that reduce greenhouse gas emissions, so that the increase in global warming is minimized.

Introduction. Climate change relates to long-term trends in temperature, moisture and precipitation, and wind speeds, for example, that are averaged over many observation points, over periods of years.  Weather, on the other hand, relates to localized trends in these variables on the scale of days.  Thus changes such as global warming depend on observations involving recording and evaluating both routine weather patterns, which constitute the vast majority of the data, as well as the quite rare extreme events that appear in news headlines.  In this post, we discuss recent extreme weather events as examples for a discussion of economic effects.  Their occurrence is consistent with trends predicted by climate models for global warming.

Floods in Pakistan, August 2010.  The Indian subcontinent, including Pakistan, experiences monsoons every summer.  Monsoons are regular patterns of relatively heavy rainfall generally lasting, in this area, from June through September.  The monsoon of 2010 brought exceptionally heavy rainfall during July and August, indeed lasting into September, including the Indus River region.  The flooding began in the northern and western mountainous regions, and grew in amplitude and volume as the flood moved downstream.  The floods were the worst since 1929.  Losses included 1,980 deaths and over 100,000 farm animals killed.  The flooded area totaled more than 100,000 square km (38,600 sq. mi.), which, if a square, would be almost 200 mi. per side.  The flood impacted the lives of more than 20 million people, which is about 10% of the nation’s population.  1.6 million homes were lost, and agricultural lands were under water, much of which lasted several months, and included serious erosion of agricultural soil.  At least one season’s worth of seed (i.e. that already planted) was destroyed.

The World Bank participated with the Asian Development bank in preparing a Damage and Needs Assessment for Pakistan.  The Assessment included factors such as  near-term relief of displaced populations, and early and long-term recovery and reconstruction, including homes, schools and infrastructure, rehabilitation of agricultural needs.  It estimated that the damage totaled US$10 billion, and that total relief, recovery, and reconstruction costs could reach as high as US$10.9 billion.  A similar cost assessment was reached by the Humanitarian Information Unit (HIU) of the U. S. Department of State.  These cost estimates most likely need to be enhanced by a large factor in view of the low standard of living in Pakistan.  According to The Economist’s Pocket World in Figures, 2011 Ed. (Profile Books, Ltd., London), the GDP per head in purchasing power parity in Pakistan, on a scale for which the U. S. is 100, is 5.5.  In other words, items and services valued by the World Bank and the HIU at about US$10.9 billion in Pakistan would require up to 18 times higher expenditure, or almost US$200 billion to accomplish the same relief, recovery and reconstruction in the U. S.

A comment in the scientific journal Nature as the flood was occurring did not unequivocally associate this flooding event with global warming.  A meteorologist described an unusual jet stream event as an immediate factor in generating the rainfall that led to the flood.  The article also points to large growth in the population and its strains on land use.  The comment does indicate more generally that, as the global temperature continues to rise, the capacity of the air to contain water vapor also increases (see this post), thus increasing rainfall.  Already the Indian subcontinent is experiencing heavier rainfall than earlier in the past.  As quoted in the comment, Jeff Knight, a climate expert at the UK Met Office Hadley Centre said "climate change will be a small but steady contributor to rainfall in the region". Indian climate scientists have documented an increasing frequency of extreme rainfall events, and a decreasing frequency of moderate events over India between 1951 and 2000, as the global temperature has been increasing (Science, 2006, Vol. 314, pp. 1442-1445).

Drought in Russia, Summer 2010.  A large area of Russia east and west of the Ural mountains experienced extreme heat in the summer of 2010.  According to Barriopedro and coworkers (Science 2011, Vol. 332, pp. 220-224; see Note 1) a zone north of the Black and Caspian seas experienced 7 day temperatures higher than the average for the period 1970-1999 by about 10-12ºC (18-22ºF) with a probability more than 99.99% (4σ), and a larger zone, extending from France well into Siberia was about 6-7ºC (11-13ºF) higher with a probability more than 95% (2σ) (the temperatures given are my readings of a color scale shown over a map of Europe and so may not be fully accurate).  Similar deviations from average are mapped for 15, 31 and 81 day periods, all centered over the same region of Russia.  The heat wave of 2010 probably broke 500 year temperature behavior.  By use of climate model computations that incorporate various assumptions for the amount of greenhouse gases added to the atmosphere, the authors predict that “mega-heatwaves” are 5 to 10 times more probable than in the past over the coming 40 years.

Lobell and coworkers published a study of worldwide crop yields for the major staple crops corn, rice, soybeans and wheat in Science online on May 5, 2011     
(10.1126/science.1204531; see also this post).  In general, crop yields decreased during recent times.  Specifically for the present topic, compared to 1960-2000, results for the wheat crop in Russia for 1980-2008 declined on average about 13%.  ­­­Over this interval the atmospheric content of the greenhouse gas carbon dioxide was increasing, and global temperature was also increasing.  The authors correlated the decreasing yield with warming climate trends.

The extreme temperature trend across Russia caused a drought that severely decreased its wheat crop during 2010.  According to the New York Times in August 2010 the 2010 harvest was projected at about 70 million metric tons (1,000 kilograms per metric ton, about 2,200 pounds).  More recently, Bloomberg News reported that the crop failure amounted to one-third of the normal harvest.  (World-Grain.com places the wheat harvest the previous year at 61 million metric tons, and the 2010 harvest was 41 million metric tons, or a drop of one-third of the crop.  Harvests of all grains, wheat and barley fell 40%.) The preceding year’s harvest, in contrast, was 97 million metric tons.  Before the 2010 drought, Russia exported 21.4 million metric tons of wheat in 2009, about 17% of global exports.  But Russian President Putin stopped all exports in 2010, in order to conserve his nation’s supply. 

The economic costs of this crop failure are very high.  To begin with, the lost value from the lower yield, estimated using the November 2010 price of $270/metric ton and an estimated loss of 30 million tons gives $8.1 billion.  This represents the direct loss to Russian agriculture.  In addition, this crop loss as well as others elsewhere in the world for wheat and other staples, has constrained supply in the face of increasing demand worldwide, leading to sharp price increases. 

The sudden disruption in world wheat supply by Russia caused an increase in the price of wheat of US$100 per metric ton.  According to World-Grain.com as of April 5, 2011, Russia extended its export ban to July 1, 2011.  Ukraine has also imposed export restrictions.  Since world markets are connected, one cannot ascribe increases in prices for wheat and other staples only to the Russian crop failure of 2010.  Nevertheless, any persistent shortfalls in the supply of wheat and other grains worldwide have a serious socioeconomic impact, especially in poorer countries of the world.  In them, of necessity a significant proportion of a family’s available cash is needed for purchasing food.  According to the Food and Agricultural Organization, a United Nations agency, as reported by Hürriyet Daily News in May 2011, the Cereal Price Index for April 2011 was 5.5 % higher than in March, and 71% higher than in April 2010.  Price increases limit the ability to feed a family, and potentially lead to social and political unrest.

Costs of U. S. Wildfires.  Our previous post presents data that from the mid-1980’s the frequency of wildfires in the American west has increased almost four times over the average frequency from 1970 to 1986.  The increase occurred as an abrupt change from the earlier pattern in the mid 1980’s.  The total forest area consumed was more than 6 ½ times greater than before.  Higher temperatures during spring and summer correlated highly with the frequency increase, and the season for reported fires also grew longer by more than 2 months.

Expenditures by the U. S. Forest Service for fighting wildfires grew from a range of $100 million to $300 million per year in the 1970’s to over $2 billion per year by 2008, with a sharp increase in expenditures beginning in about 2000.

Forest fires in Alaska have become more damaging recently, and result in more CO2 being released into the atmosphere by the combustion than is stored by forest growth.  This contributes to the worsening of global warming, turning forests into sources of greenhouse gases rather than a “sink”, or storage mechanism.

Fighting wildfires incurs considerable costs (suppression costs), which are documented by the U. S. Forest Service.  But once a fire is extinguished, further direct, indirect and societal losses continue to accumulate.  These have been identified by Zybach and coworkers in an econometric analysis characterized as LCD (least cost plus damage) or C+NVC (costs plus net value change).  These may grow to many times the immediate suppression costs. 

Details.  The authors characterize the following factors to be included in a calculation of costs plus losses.
1.     Suppression costs include immediate firefighting expenses, home and property losses, evacuation and emergency operations, preparative measures, training, supplies and equipment.
2.     Property costs from damage or destruction of public and private property.  This includes utilities damage, damage or loss of timber as an asset, agricultural crop and livestock losses.  Certain expenses after the wildfire include salvage and cleanup, devaluation of property, and others.
3.     Public health factors include diseases brought on by smoke inhalation.  These may be acute at the time of the wildfire, or longer lasting effects.
4.     Vegetation losses include not only destroyed standing timber, but longer lasting damage that hinders restorative growth, grazing and foraging lands, and loss of wildlife habitat.
5.     Wildlife is damaged by death, loss of range, expenses related to restoring habitat, and possibly loss of range for endangered species.
6.     Water losses arise from use of water in fighting a wildfire, loss of drinking water and irrigation sources, and degradation of water quality after the event.
7.     Air and atmospheric effects include emissions of particulates and noxious gases, greenhouse gas emissions.
8.     Soil erosion arises because the wildfire area can no longer hold rainfall or resist wind.  Soil becomes less fertile and productive and there may be need for relieving sediment formation.
9.     Recreation and esthetics losses include loss of natural areas for recreational activities, scenery and loss of hunting opportunities.  These losses contribute to a decrease in economic activity.
10. Energy losses arise from destruction of utility transmission lines and the resulting interruption of rate-paying power service, as well as loss of consequential future sales.
11. Heritage losses arise by damage to or destruction of historical and archeological sites.

When all these factors are included in a cost-plus-loss analysis, the total may mount to as high as 10 to 30 times the direct cost of the suppression effort.  The Forest Service cost estimates cited above represent only suppression costs.  Thus the comprehensive reckoning of the cost of wildfire activity could reach $20 to $60 billion per year, as of 2008.  Examples of cost analyses for six fires between 2000 and 2003 are shown below.


Source: The True Cost of Wildfire in the Western U.S. , Western Forestry Leadership Coalition, April 2009 (updated April 2010). http://www.wflccenter.org/news_pdf/324_pdf.pdf

The last column in the table shows the fraction of the total cost of the wildfire devoted to direct firefighting activity, expressed as a percent.  It is seen that the fraction varies widely, ranging from 3% to 53%. 

The previous post, entitled “Extreme Wildfire Events and Global Warming”, pointed out that higher temperatures and aridity over the western United States stresses its forests, so that they are less resistant to pests, including bark beetles.  In recent years loss of forested areas to bark beetle infestations has been three times as great as losses to wildfires, for a total loss estimate that is four times larger than for wildfires alone.  Most of the loss factors identified above in the econometric analysis for wildfires are also valid for forest death due to beetles.  This leads to a total economic cost from loss of forests from all sources in the American west of $80 to $240 billion per year, as of 2008.

Conclusions.

Global warming leads to climatic changes that, depending on geography and climate patterns, can increase precipitation to produce extreme rates of rainfall and consequent flooding in some regions.  In other regions elevated temperatures may be accompanied by extreme aridity producing drought conditions.

This post presents three anecdotal examples of consequences of extreme weather events which are, or may be considered to be, due to global warming.  The extreme flooding in Pakistan in 2010, the drought and wheat crop loss in Russia, Ukraine and Siberia, and increased incidence and severity of wildfires in the American west, are likely correlated with global warming.  It is important to emphasize the point made in the introduction that weather patterns over weeks or months are not directly ascribable to global warming.  Global warming is a change in climate which is described over years and over large regions of the globe, if not the entire planet.  Nevertheless, single extreme events are considered consistent with the predictions of models for global warming that lead to the phenomena experienced in these anecdotal examples.

The anecdotes presented here make clear that global warming brings with it enormous economic and societal costs.  Many of these costs can be quantified, as has been done here.  Since floods, droughts and wildfires occurred before recent decades, we cannot say that the financial costs mentioned here are fully due to global warming, but rather that a fraction of them are.  Such fractions, for sake of argument but which cannot be justified in this post, may range from, say, 20% to 50% of the total costs given.  These fractional costs represent the incremental cost that may be directly correlated with the effects arising from global warming.

As pointed out in each section, the effects of the Russian drought, the Pakistani floods, and American wildfires, each in their own way bring enormous economic costs, humanitarian distress, and long-lasting effects.  We, as citizens of the affected regions and as citizens of the world, to date have only reacted after the fact, responding to the disaster in question.  But we have the option of taking measures commensurate to the task of reducing emissions of greenhouse gases with the objective of limiting the extent of global warming.  These measures likewise involve expenditures of large sums of money, and must be undertaken as soon as possible in order to avert even more, and more severe, extreme weather events. 

Note 1. Abstract available online free, or the full article for a fee or through personal or institutional subscription.  Many public libraries, and university libraries open to the public, receive the journal.

© 2011 Henry Auer

Friday, June 10, 2011

Extreme Wildfire Events and Global Warming

Summary: Wildfires have occurred in the western United States with increasing frequency and greater severity in recent decades.  This has been associated with increased average temperatures, lower precipitation and lower humidity in the affected areas.  The stress on trees from these conditions make them prone to bark beetle infestation as well, leading to extensive loss of trees from the pests, even more pronounced than from wildfires.  Similar patterns arise elsewhere in world as well. 

These events, as well as extremes of rainfall, major flooding, and diminished yields of important staple crops, are all attributable to global warming, and are predicted to become worse as more greenhouse gases accumulate leading to even greater warming of the atmosphere.  Humanity is faced with choices concerning global warming.  We may choose preventive investments in policies to minimize the worsening of global warming.  Otherwise we may choose simply to respond to the damages inflicted by extreme events, which would not contribute to putting in place measures to minimize warming.

Introduction.  Worldwide long-term average temperatures have been increasing since the industrial revolution began, and have been especially pronounced since the middle of the 20th century.  This warming is associated with mankind’s ever-increasing use of fossil fuels for energy, resulting in emissions of greenhouse gases into the atmosphere.  Worldwide, the Intergovernmental Panel for Climate Change has assigned a high probability that greenhouse gas emissions are a major contributor to the warming of the planet.  Warming brings about many consequences detrimental to human wellbeing.

Wildfires in the Western U. S.  Wildfires in the western U. S. (West) have been widely covered in the press in recent years, giving an appearance that they have actually become more frequent, and more damaging, than in earlier decades.  According to A. L. Westerling and coworkers (Science 2006, Vol. 313, pp. 940-943; see Note 1), as of 2006 fighting wildfires in the West costs over US$1 billion per year; this does not count property damage or the value of the destroyed timber.

Generally, possible causes for increased wildfire activity include human activity and land use changes, uncharacterized climate changes (such as global warming), and the known long-term climate patterns, the Pacific Decadal Oscillation, the El Niño/La Niña cycle, and recent droughts in 2000 and 2002.  Land use has drawn water from natural sites for use by humans at remote locations, especially the rapidly growing cities in the region, promoting aridity in the natural settings.  While the El Niño/La Niña cycle is well known, Westerling and coworkers state there appears to be no correlation of the cycle with wildfires in the 20th century.

Wildfire Activity Has Intensified in Recent Decades.  Westerling and coworkers examined wildfires greater than about 1000 acres on federal lands from 1970 to 2003.  They found that after the mid-1980’s the frequency of fires was almost four times greater than the average frequency from 1970 to 1986, an abrupt change in the pattern, and that the total area consumed was more than 6 ½ times greater.  Higher temperatures during spring and summer correlated highly with the frequency increase, and the season for reported fires also grew longer by more than 2 months.  In addition, years with high temperatures correlated with earlier melting of winter snows, so that both factors work to decrease available moisture, leading to drier combustible fuel, during the season of prevalent fires.  Years with early melting had five times as many wildfires as years with late snowmelt.  Summer temperatures during 1987-2003 were 0.87ºC (1.57ºF) warmer than for 1970-1986, and were the warmest since recordkeeping in the region began in 1895.  A similar trend is noted for Canada from 1920 to 1999 (N. P. Gillett et al., Geophys. Res. Lett., 2004, Vol. 31, L18211).  Although the authors did not seek any relationship of their historical analysis of past events with greenhouse gas-induced global warming, they do point out that projections of future warming due to increasing amounts of atmospheric greenhouse gases reinforce the recent trends of more and larger forest wildfires.

Effects of Warming and Aridity on Forest Growth in the American Southwest.  Williams and coworkers (Proc. Natl. Acad. Sci., 2010, Vol. 107 pp. 21289–21294) (see Note 2) assessed local forest growth year-by-year at 1,097 locations in the U. S. by recording tree ring intervals.  Wide ring intervals indicate favorable growth conditions, and narrow intervals reflect poor conditions.  These were compared to predictions of growth based on modeled variations in the climate during the 20th century, including effects of temperature, precipitation and relative humidity.  The modeled predictions correlate with high statistical significance with the observed tree ring growth patterns, indicating that the model is very likely appropriate.  The forests of the American southwest are particularly sensitive to climatic variations.  As trees are stressed, not only are they more prone to ignition and burning, but they also become more susceptible to insect pests such as bark beetles.  The authors estimate that up to 18% of southwestern forests died or were lost from 1997 to 2008, about one-fourth to fires and the remainder to bark beetle infestations. They believe that these losses are due to the extreme conditions of aridity and high temperature that prevailed over this period.

The model was used to predict future forest growth in the period 2050-2099 compared to the period 1950-1999.  The results predict variously about 15% to as high as about 45% decrease in growth, dependent on tree species and the particular model used.  The authors discuss various options for further study, monitoring and remedial planting as these changes unfold.

Worldwide Wildfire Frequency from 850 to 2100.  Pechony and Shindell (Proc. Natl. Acad. Sci., 2010, Vol. 107 pp. 19167–19170) (see Note 2) used detailed climate models to create a worldwide pattern of wildfire frequency from 850 to 2003.  The results correlated well with geologic charcoal patterns which characterize wildfire occurrence in the past.  This agreement permitted modeling of future wildfire occurrence with confidence.

From 850 to the start of the industrial revolution at the beginning of the 19th century fires appear to have been governed primarily by global patterns of precipitation rather than temperature; the latter was relatively constant throughout this interval.  Likewise, human population density was unchanged.  Starting with the industrial revolution wildfire frequency was more correlated with human activity.  Temperature increased dramatically over this period coupled with “unprecedented” increase in burning of fossil fuels; human population density has grown about 8-fold since 1800.  Among the causes of wildfires was clearing of forested land for agricultural use.  Starting about 1900 there was a decrease in fire activity due to human intervention and fire suppression.

Future trends were modeled using scenarios standardized by the Intergovernmental Panel on Climate Change.  In contrast to the early precipitation-modulated pattern, and the recent human intervention affecting wildfire frequency, future frequency reflects the exacerbated warming of the earth due to continued use of fossil fuels.  Thus in the future the climate will be a major factor driving wildfire frequency.  As with modeled patterns of changes in precipitation and aridity in various regions of the world, predicted patterns for the frequency of wildfires varies across the globe.  In the United States, the western region will have more wildfires, while the east will have fewer, according to the models.

Conclusions.  The reports chosen here are but a selection of many recent articles in scientific journals dealing with increased frequencies of wildfires in the U. S. and elsewhere in the world.  Climate models using recognized future scenarios for greenhouse gas emissions predict future climate changes that will likely make the West even warmer and more arid than at present.  These factors are highly likely to make the frequency and/or severity of wildfires in the region even worse than they are today, as we consider the remainder of the 21st century.

Recent posts on this blog have described a number of other extreme climate-related events that correlate with global warming.  Two articles appearing in the journal Nature have unequivocally ascribed extreme rainfall across the Northern hemisphere up to 1999, and a single catastrophic rainfall-induced flood in England and Wales in 2000, respectively, to global warming.  These articles are even more significant because their findings relate to events that precede the first decade of the 21st century, the hottest decade in recent history.  A Warmgloblog tutorial helps make plausible the relationship between global warming and the energetics of cloud formation and condensation of water vapor into rain.

In two other recent reports, decreased yields of the staple crops wheat and maize (corn), but not of rice and soybeans, was directly attributed to global warming in recent years; and the uptake of atmospheric carbon dioxide by growing green plants worldwide was found to be diminished in those regions experiencing droughts induced by global warming.

The various phenomena described here tie past extreme climatic events to global warming with very high to likely probabilities, depending on the authors of the different reports.  All the reports make clear correlations of future probabilities for extreme events with global warming by the very nature of the way in which the predictions were made: use of recognized climate models incorporating standardized scenarios for increases in greenhouse gas concentrations.

The adverse consequences of these various extreme events carry enormous human and societal burdens, as well as major economic costs.  Economic costs arise either from the need to recover from the events after they occur, or a perceived need to “buy insurance” before they might occur by taking steps that make adaptation easier.  Many in positions of responsibility protest against taking action to minimize the worsening of global warming because of the high financial and economic costs involved.  But it must be recognized that “there is no free lunch”.  We can choose to invest resources in a way to minimize global warming, bearing the costs while infusing our economies with the demand for new jobs.  Otherwise we can wait for extreme events to occur at times that are not predictable ahead of time, and then rush to recover and rebuild using emergency responses that do not address the basic problem.

                   ==========================================

Note 1. Abstract is available for free online; full article is available by subscription or purchase online.  The journal is available in paper form in many public and university libraries.

Note 2. Full article is available for free online.

© 2011 Henry Auer

Friday, June 3, 2011

Energy Efficiency: A U. S. National Academies Report

Summary.  The U. S. National Academies issued a report, “Real Prospects for energy Efficiency in the United States”, in 2010.  The report examines ways in which energy efficiency programs and policies can make significant contributions to reducing new emissions of greenhouse gases by 2030.  Reduced emissions can be achieved in residential and commercial buildings, in the transportation sector, and in industrial processes.  For this reason, energy efficiency should form a major component of efforts to limit greenhouse gas emissions and minimize global warming.

Introduction Global warming is currently occurring, due to the release of ever-increasing amounts of greenhouse gases into the atmosphere.  This conclusion is broadly accepted among the scientific community, and understood by much of the American public at large.  Most greenhouse gases arise from mankind’s burning of fossil fuels for energy, starting with the industrial revolution in the nineteenth century.

Among developed, industrialized countries of the world, the United States is the only major emitter of greenhouse gases without a single, unified policy at the national level that addresses the problems arising from burning fossil fuels.  In the absence of leadership at the federal level, various regional, and even local, programs have been put in place to lower emissions of greenhouse gases.  These include the Western Climate Initiative, the Midwest Greenhouse Gas Reduction Accord, and the New England and mid-Atlantic Regional Greenhouse Gas Initiative.  These programs have varying levels of coverage and differing terms of duration. 

Energy Efficiency.  An important, but not widely recognized, component of plans to minimize emissions of greenhouse gases is increasing energy efficiency.  By this is meant setting in place projects and procedures that lead to more effective use of energy resources that are already in use.  That is, efficiency leads to more of a useful energy product being derived, per unit of the fuel consumed.

The National Academies Report.  The U. S. National Academy of Engineering, a component of the National Academies, issued the report “Real Prospects for energy Efficiency in the United States” in 2010.  A free summary may be obtained here.  As noted in a recent local conference held on installing energy efficiency measures in public buildings, increased efficiency would be harvesting the “low hanging fruit” of the tree of greenhouse gas reduction. 

The report was prepared in response to a charge to the National Academies as part of the larger task directed to America’s Energy Future.  The Energy Efficiency panel was asked to set forth the possibilities for improving efficiency in transportation, housing and industry, reporting on technologies currently available, those already known and capable of being put in place, and those not yet characterized.  As with America’s Energy Future, the report describes past and present status and future possibilities, but is not intended to recommend particular policy approaches.  The panel included experts drawn from the academic realm, nonprofit and governmental organizations, and the commercial world; the draft report was reviewed by a different panel of experts drawn from similar sectors of society.

Main Results.  The total amount of energy used in the U. S. in 2008 is given by major economic sector in the table below, in units of quadrillion (1015) Btu (British thermal units; the amount of energy needed to heat 1 pound of water by 1ºF, about 1,055 joules).


Sector
Quads
Pct (%)
Transportation
28.0
28
Residential
21.6
22
Commercial
  Buildings
18.5
19
Industry
31.3
31
        TOTAL
99.4
100


Source: Summary, Real Prospects for Energy Efficiency in the United States,
http://books.nap.edu/catalog/12621.html; citing U.S. Energy Information Agency Annual Energy Outlook 2008.

The panel assessed each of these sectors in order to identify the ways that savings in energy used could be accomplished, and by how much.  The following table presents the report’s estimates of energy savings that can be achieved by two future dates, and according to two frameworks, a conservative estimate and an optimistic estimate.  (Note that there is no analysis for heavy-duty vehicles.)

Energy savings in quads relative to the U. S. Energy Information Agency Annual Energy Outlook 2008 (or a similar scenario prepared for Transportation).


Conservative
Conservative
Optimistic
Optimistic
Sector
2020
2030
2020
2030
 ================
   ======
   ======
   ======
   ======
Buildings, primary (source) electricity
9.4
14.4
9.4
14.4
   Residential
  4.4
  6.4
  4.4
  6.4
   Commercial
  5.0
  8.0
  5.0
  8.0
Buildings, natural gas
2.4
3.0
2.4
3.0
   Residential
  1.5
  1.5
  1.5
  1.5
   Commercial
  0.9
  1.5
  0.9
  1.5
Transportation, light-duty vehicles
2.0
8.2
2.6
10.7
Industry, manufacturing
4.9
4.9
7.7
7.7


           TOTAL
18.6
30.5
22.1
35.8

Source: Summary, Real Prospects for Energy Efficiency in the United States,


In the absence of savings arising from energy efficiency measures, the report estimates that energy consumption would be 111 quads by 2020, and 118 quads by 2030.  These results lead to the important conclusion, according to the report, that under the optimistic estimate, by 2030 the energy savings could be 30% below the forecast usage without the efficiency measures (26% below the forecast usage by the conservative estimate).

Main Findings.  The report’s most comprehensive results are summarized here, just below.  (Details and some other material appear at the end of this post, after Conclusions.)

First, technologies to achieve significant gains in energy efficiency exist at this time, or are reasonably expected to become practical, in the period up to 2020, or 2030.  These efficiencies would permit major savings in energy usage, and corresponding savings in costs to end users.  These have been summarized in the preceding section.  The “business-as-usual” reference trend against which these savings is assessed are those projected in the U. S. Energy Information Agency’s (EIA) Annual Energy Outlook, 2008.  To the extent that prices for using energy increase by market forces, or that governmental policies are put in place that increase the price of energy, these efficiencies should be readily accomplished  (see the table above) and the corresponding savings achieved.  The size of the energy savings that can be achieved is considered large enough to reverse the need to install new electricity generating facilities.  The investment involved in achieving energy efficiency is far less than needed for new generation facilities, and are implemented more rapidly.

Second, if all modalities for achieving energy efficiency in the buildings sector alone were to be implemented, there would be no need to add new net electricity generating facilities.  This comes about because the efficiency savings in the table above from the buildings sector to 2030 exceed the forecast by the EIA for anticipated needs for new generation.  The report assesses barriers that could arise and that hinder full achievement of these efficiencies.  These include high initial costs, alternative uses competing with investment in efficiencies, volatility of fuel prices which inversely affects incentives to proceed, as some examples.  On the other hand, the report cites other U. S. federal programs that have already accomplished efficiencies, such as efficiency standards for appliances and transportation, combined heat-and-power generation, and the ENERGY STAR® program.

Third, the report recognizes that significant barriers to installing energy efficiency exist, and must be overcome.  To achieve this, widespread support from public and private institutions needs to be marshaled.  Examples of programs in large states such as California and New York provide tutorial examples for appropriate policies to put in place.  One major difficulty arises from the long lifetimes of buildings once constructed.  This emphasizes the need to bring new efficiency technologies into construction codes, and into practice, as soon as possible.

Fourth, buildings and infrastructure, once in place, have long lifetimes that lock in the features used in their construction.  For this reason it is important to carry out capital projects with an eye to incorporating known energy efficient design features right away. 

Conclusions.  Energy efficiency programs can provide significant reductions in energy usage in the near term in return for reasonable expenditures of funds invested up front.  Depending on the sector of the economy and the technology or method that is put in place, as much as 26-30% savings in energy use could result by 2030.  This broad conclusion, effective at the national level, indeed internationally, is reinforced by the report in the immediately preceding post on energy efficiency retrofits in public buildings.  Frequently the costs of instituting energy efficiency measures are less than those needed for constructing new energy facilities that are based on renewable energy or that incorporate new technologies for energy utilization. 

Carbon dioxide (CO2), an important greenhouse gas, accumulates in the atmosphere because it is a stable atmospheric component, not subject to degradation.  Its lifetime is measured in centuries, if not longer.  Currently CO2 concentrations are at about 390 parts per million (ppm) and increasing by about 2 ppm per year because humanity continues to burn fossil fuels at a high rate.  We can think of the atmosphere as being like a CO2 bathtub, filling with new CO2 from the faucet each year, and with minimal reduction in the level of CO2 by exiting the drain. This increase worsens the effects of global warming with each passing year.  The information presented here argues strongly that implementing energy efficiency programs should be a major part of our efforts to limit emissions of greenhouse gases.


Details.

Historical Review of Policies and Programs.  The report reviews energy efficiency efforts already in place.  A)  Vehicle fuel economy standards have been increased in the U. S. by federal regulation.  They were set at a relatively low level in 1985.  According to the report, efforts to increase the standard were successfully blocked by auto manufacturing companies for years.  In 2007 the corporate average was raised to 35 miles per gallon by 2020.  B) Appliance efficiency standards enacted by certain American states and at the federal level have resulted in important savings in use of electricity over recent decades.  C) In the U. S. building energy codes are issued at the municipal level.  Standards are proposed by national professional organizations and revised frequently; nevertheless their adoption is not universal or ensured, and they may be poorly enforced. 

D) Federal research and development has led to important improvements, many of which have been successfully commercialized.  E) Various American federal tax incentives have been enacted, and many have lapsed, encouraging homeowners to install energy-saving retrofits.  These are complemented in the U. S. by programs at the state level as well as by private electric and gas utility companies.  F) American federal law promotes purchase and distribution of electricity from facilities that use combined heat-and-power facilities (co-generation).  G) In the U. S. consumer education supporting energy efficiency is promoted by the federal ENERGY STAR® program that focuses consumers on home appliances that are rated to use less power.

The American Energy Economy in 2009.  The EIA displays energy flows from its sources through its uses and ending with its products and waste in a comprehensive energy flow chart, shown for 2009 in the following graphic.  The main reason for showing this graphic here is explained in detail in the legend to the graphic.

Energy flows in the U. S. in 2009.  Energy sources on the left are, top to bottom, solar, nuclear, hydro, wind, geothermal, natural gas, coal, biomass and petroleum.  The colored lines show the flows of energy from these sources to its various uses: electricity generation (orange, top left); and residential, commercial, industrial and transportation (pink, medium right).  All light gray flows leaving these five uses represent waste heat that is lost, and is aggregated as Rejected Energy at the upper right.  Useful products of energy are generated electricity (orange flows delivered to the pink destination boxes), and dark gray flows to the aggregate box for Energy Services, middle right).
Source: U. S. Department of Energy Lawrence Livermore National Laboratory and Energy Information Agency. https://flowcharts.llnl.gov/content/energy/energy_archive/energy_flow_2009/LLNL_US_Energy_Flow_2009.png


The important conclusion is obtained by comparing the light gray box for rejected energy (i.e., energy wasted as heat and lost to the environment) at the upper right, 54.64 quads, with the dark gray box for energy services (energy applied for a useful purpose), 39.97 quads.  This shows that useful energy captures only 42% of the total energy present in fuels and other energy sources input at the left of the flow diagram.  Since most of the input energy derives from fossil fuels, this leaves ample opportunity for capturing additional useful energy, and reducing wasted energy, by increasing the efficiency with which energy is used.  Most of the losses occur in electricity generation (26.1 quads; 48% of total rejected energy) and transportation (20.2 quads; 37% of total rejected energy).  This increase in efficiency would lead to economy-wide reductions in the emission of greenhouse gases.

Buildings.  As seen from the first table above, residential and commercial buildings combined use about 40% of the total energy consumed in the U. S.   Of this about ¾ is provided by electricity, and most of the remainder from natural gas.  This energy is devoted primarily to heating, cooling and ventilation, and to lighting.  Efficiency savings are projected to accumulate at a rate of about 1.2% per year for electricity and 0.5% per year for natural gas, leading to a cumulative savings rate of 25-30% per year over the next 20-25 years.  (Not included in these estimates is additional saving by integrated design of buildings that combine efficiencies between the uses itemized above with enhanced structural design.  Examples of commercial buildings incorporating such features have resulted in energy savings as high as 50%.)  Other improvements in several areas are being developed that could contribute even more energy savings.  These new developments could become widely practiced under favorable policies.

Factors cited in the report that could impede putting energy efficiency in operation include public reluctance to undertake retrofitted efficiencies and the long building lifetimes mentioned earlier.  In spite of these factors, placement of energy efficiency could become more favorable with higher energy prices, increased awareness of the hazards of global warming, increased willingness by the public and by business to act to reduce greenhouse gas emissions, and a growing appreciation of environmentally-friendly building practices.

Transportation.  The transportation sector encompasses vehicle transport, rail, air and shipping.  This sector consumes 28% of all the energy used in the U. S., of which about 97% originates from petroleum.  Vehicle transport is the major component, about ¾, used to move people and goods on roadways, and much of this originates from light-duty cars and trucks. 

The report emphasizes that important reductions in greenhouse gas emissions from transportation will come from incremental improvements, rather than from a few major changes in technology.  The internal combustion engine (ICE) and its fuel delivery infrastructure is well established in transportation, and is difficult to minimize or eliminate in the short term.

Improvements in passenger vehicles include reducing their weight, enhancing the efficiency of the engine and drive train, and reducing losses in moving the vehicle on the road.  Many of these changes are currently available or within reach, but not widely deployed.  A concern is that any gains in efficiency from measures such as these would be diverted into producing larger and/or more powerful cars, thus defeating the purposes of reducing emissions in the first place.  The consuming public in the U. S. would need to shift its priorities in favor fuel efficiency and reducing emissions of greenhouse gases.

The report foresees that improvements such as the above, and others, could produce reductions in fuel consumption, and in emissions of greenhouse gases, from today’s levels by 2035 to the range of 55-65% of today’s levels, depending on the type of ICE.  Hybrid-electric vehicles reduce fuel consumption to about 20-40% of present levels, and greenhouse gas emissions to 35-45% of today’s levels (which accounts for generating electricity from fossil fuel-driven power plants).  Fully battery-powered electric vehicles and fuel cell-powered vehicles consume no petroleum fuel directly, but emit greenhouse gases as for hybrid vehicles in view of their dependence on electricity for charging batteries or for manufacturing hydrogen fuel.  Only a major shift to renewable electric generation could significantly affect this factor.

In contrast, establishing non-ICE alternatives such as electric-powered or hybrid-electric cars, or fuel cell powered cars using, for example, hydrogen, is poorly advanced at this time.  Aspects of technology, such as batteries and on-board hydrogen storage, are still under development, and infrastructure to support these alternatives is largely absent.  The report points out that timelines for deploying new technologies are long, in view of development, sales, installing infrastructure, and removing existing vehicles, which have long lifetimes, from service.

The report notes that heavy trucks may experience 10-20% improvements in fuel economy.  Airplanes, which have undergone major improvements in the 20th century, may still gain up to 35% in fuel economy; but it is widely agreed that air transport will be expanding considerably in future years, offsetting gains in efficiency.  Ships and railroads are already highly efficient, with little further gain anticipated.

The report points out that a systemic analysis of transportation in the U. S. could lead to increased efficiency in the utilization of resources.  This could include reorganizing land use as living space, promoting collective mechanisms for travel, and forecasting how changes in investments and policies could affect energy use devoted to transportation.

Industry.  Manufacturing and other industries, including petroleum refining, consumed 31% of energy used in the U. S. in 2008.  The U. S. EIA forecasts that energy consumed by industry will increase from 31.3 quads in 2008 to 34.3 quads in 2020.  Independent studies cited in the report estimate that energy savings in the industrial sector can be appreciable, 4.9-7.7 quads (14-22%) by 2020, using efficiency measures that provide at least 10% rate of return or improvements that exceed the cost of capital needed by a risk premium.  An important source for enhanced efficiency is combined heat and power facilities (co-generation) that capture additional energy that would otherwise be dissipated.  On the negative side, however, if account is made for imports and exports that do not incorporate energy efficiency in their production, an additional energy expenditure of 5 quads is envisioned.

Beyond 2020, more revolutionary advances are expected in areas such as new sources for heat and power, as well as more efficient technologies for production that capitalize on advances in nanotechnology and micro-manufacturing, as well as more effective resource recovery and reuse.  Other examples include advanced sensors and controls, microwave processing of materials, use of nanotechnology to provide novel ceramic coatings, and high temperature membrane separation processes.

The report notes that in many industries for which energy costs are not high, the incentive to undertake energy efficiency projects is low, compared to competing uses for capital such as human resources, new product research and development, and the need to comply with agency regulations.  Factors that favor increased energy efficiency include high and fluctuating costs for fuels and competitive pressure to reduce overhead and costs of manufacture.  

© 2011 Henry Auer