Summary. The developing world generally has higher rates of population growth and economic development than do developed countries. Energy use and greenhouse gas emissions of China India
To the extent that such development continues without constraint on emissions of greenhouse gases, the world risks exceeding the limit of an increase in worldwide average temperature of 2ºC agreed to by the nations of the world. Warming worldwide temperatures bring with them increased occurrence of extreme weather events that cause high levels of physical and economic harms. Instead of expanding use of fossil fuels, the nations of the world should agree on new measures to “decarbonize” energy production and limit greenhouse gas emissions, thereby constraining planetary temperature rise within the agreed limit.
Introduction. The use of energy, primarily provided by fossil fuels, across the globe has been expanding inexorably over past decades, and is forecast to continue growing by large amounts in coming decades. Correspondingly the rate of emission of resulting greenhouse gases is also rising dramatically. Most of this growth originates in the developing countries of the world, which generally are expanding both in their populations and in their economic activity. Both factors contribute to expanding demand for energy. This post examines these issues.
Many points are summarized in the main body of this post, with expanded information and data provided in the Details section at the end.
Historical trends for energy use and CO2 emissions for China and India. China India
In 2009 China India Nov. 21, 2011 ). As India GDP tables below in the section Projected future trends), energy demand is expected to rise significantly.
Past growth in use of fossil fuels by China India
Generally, use of fossil fuels, and especially of coal and oil, has grown 4- to 6-fold, or even more, from 1980 to 2009. Emissions of CO2, the greenhouse gas that is the product of burning fossil fuels, likewise grew at comparable rates.
Energy use and emissions for the period from 1997, the year the Kyoto Protocol was agreed on, and the last year in the graphs below, 2009, are evaluated. The date of the Kyoto Protocol is used here, because, as developing countries, China India
- coal use by
China India China India - CO2 emissions from
China India
Coal is the predominant source of energy in China
Coal is a large source of energy for India China India
Neither country had large energy sources from renewable sources such as wind and solar power as of 2008-2009.
Projected future trends
World population growth. The USEIA issued its International Energy Outlook 2011 (IEO) in September 2011. The IEO projects population increases among countries of the world in its International Energy Outlook 2011. Data extracted from this report for the U. S. China India
Population growth
Region/country | 2008 Actual | 2035 Projection | Av. annual % chg. |
305 | 390 | 0.9 | |
OECD | 1,209 | 1,358 | 0.5 |
1,328 | 1,450 | 0.3 | |
1,181 | 1,528 | 1.0 | |
World | 6,731 | 8,453 | 0.9 |
World per capita gross domestic product (GDP ). The USEIA projects the growth in economic activity among countries and regions of the world in its IEO. Data for per capita GDP include the following:
Per capita GDP expressed in purchasing power parity, using 2005 USD
Region/country | 2008 Actual | 2035 Projection | Av. annual % chg. |
43,349 | 65,862 | 1.5 | |
OECD | 30,601 | 47,887 | 1.7 |
5,777 | 23,694 | 5.7 | |
2,692 | 8,792 | 4.6 | |
World | 9,773 | 19,123 | 2.6 |
Projected future growth in energy use. (See Details for further information.)
Projections of future energy use drawn from the IEO relate to the USEIA’s Reference case, in which it is assumed that economic growth continues as at present, and that no policy changes are made in the future that are not currently operative. This is frequently referred to as “business-as-usual”.
In its press release, USEIA states that, largely because of strong economic growth in developing countries (non-OECD countries) including the two leaders, China India GDP is projected to grow by 5.7%/yr in China India
An extract of data presented in the IEO is tabulated in the Details section at the end of this post, following the Discussion. A graphical presentation of projected energy use is shown here.

Source: USEIA, International Energy Outlook 2011 http://www.eia.gov/forecasts/ieo/pdf/0484(2011).pdf
Projected growth in CO2 emissions. The IEO includes predictions for growth in CO2 emissions originating from fossil fuels. Data from the table in the Details section are shown in the chart below.

Source: USEIA, International Energy Outlook 2011 http://www.eia.gov/forecasts/ieo/pdf/0484(2011).pdf
Emissions from India China U. S.
The International Energy Agency (IEA) published its World Energy Outlook 2011 (WEO 2011) on Nov. 9, 2011 . It includes projections based on three scenarios. The Current Policy Scenario (CPS ) assumes no additional emissions policies implemented beyond those already in place in 2011. This inaction is projected to lead to an increase in long-term global average temperature of 6ºC (10.8ºF) by 2035. The intermediate New Policies Scenario includes policies intended to reduce emissions, but not by enough to stabilize atmospheric CO2 levels. It is projected to lead to an increase in long-term global average temperature of 3.5ºC (6.3ºF). The 450 Policy Scenario (450 PS) implements strict controls on new emissions that are intended to stabilize the atmospheric CO2 concentration at 450 parts per million; this is the level deemed adequate to keep the increase in long-term global average temperature within 2ºC (3.6ºF) above the pre-industrial level. This upper limit is based on the Fourth Assessment Report of the Inter-governmental Panel on Climate Change (IPCC), which was issued in 2007.
The IEA graphic below compares projections of Total Primary Energy Supply by global regions for two scenarios, CPS and 450 PS.

Comparison of total world energy supply under the CPS and the 450 PS. Historical data for 1990 and 2008, and projected results under the two policies for 2015, 2020, 2025 and 2035. Blue: OECD+ (developed countries); Green: OME, other major economies (developing countries); Purple: OC, other countries (developing countries); (see Note 2); Orange
Source: IEA, 2011 Key World Energy Statistics; http://www.iea.org/textbase/nppdf/free/2011/key_world_energy_stats.pdf
The chart above illustrates annual rates of use of energy, indicating that each year large amounts of the greenhouse gas CO2 are emitted. Under CPS , the annual rate keeps increasing, adding to atmospheric concentrations of CO2 at an ever-increasing rate. Under 450 the annual rate appears to level off, but each year additional CO2 still is emitted.
Nevertheless, it is seen that by 2035, adopting the stringent 450 Policy Scenario results in an overall projected decrease of 22% in total energy needed compared to CPS . The largest reduction in energy use is from the large economies of the developing world (OME), about 23%; followed by reductions in energy use by other developing countries (OC), about 17%, and reductions by OECD+ (developed countries) of about 13%.
Discussion
The Cancun Agreements were the final product (text and press release) of the 2010 conference, held under the auspices of the United Nations, and were approved by all 193 nations except one.
Among the commitments made in Cancun, developing countries, on a voluntary basis, submitted “nationally appropriate mitigation actions” planned for coming years to the United Nations supervisory body. Whereas many countries with smaller economies enumerated detailed goals and steps, countries such as China India
Country | Year for goal | Statement of goal |
2020 | Voluntary measures to reduce CO2 emissions per unit of gross domestic product ( | |
2020 | Voluntary efforts to reduce emissions intensity of its |
Developing countries such as China
The IEA warned in WEO 2011, according to its press release, that the world will enter “an insecure, inefficient and high-carbon energy system” unless it implements strong new policies to lower future emissions of CO2 and other greenhouse gases. Recent developments that signal this urgency include the Fukushima Middle East which creates instability in oil supplies and costs, and a strong increase in energy demand in 2010 which led to record high emissions of CO2.
Fatih Birol, IEA’s Chief Economist, points out that as time passes without significant action to mitigate emissions, the world is becoming “locked in” to a high-carbon energy infrastructure. Up to the point of changing policy, all preexisting energy-producing and –consuming infrastructure commits the world to continuing its carbon-inefficient energy economy. They continue to emit CO2 annually during their service lifetimes according to their originally designed (less efficient) operating specifications. This is illustrated in the following graphic, which considers that 2010 is the year of commitment.

Lock-in of annual rates of CO2 emissions from energy-producing and energy-consuming physical installations as of 2010, shown in the various SOLID colors. Projected additional annual rates of emissions from facilities newly installed after 2010, allowable under the 450 Policy Scenario, are shown in the HATCHED GREEN area at the top of the diagram. 450 envisions that the annual rate of emissions reaches a maximum by 2017 and then begins declining.
© OECD/IEA 2011. Source: IEA, World Energy Outlook 2011; http://www.worldenergyoutlook.org/docs/weo2011/key_graphs.pdf
In the graphic above emissions from committed infrastructure (solid colors) are projected to decrease year by year as the various facilities age and are removed from service. The graphic illustrates the maneuvering leeway (green shading) in annual CO2 emissions that are consistent with the 450 Policy Scenario, which is intended to ensure that the long-term average increase in global temperature is constrained to 2ºC (3.6ºF). The IEA press release states
“Four-fifths of the total energy-related CO2 emissions permitted to 2035 in the 450 Scenario are already locked-in by existing capital stock…. Without further action by 2017, the energy-related infrastructure then in place would generate all the CO2 emissions allowed in the 450 Scenario up to 2035. Delaying action is a false economy: for every $1 of investment in cleaner technology that is avoided in the power sector before 2020, an additional $4.30 would need to be spent after 2020 to compensate for the increased emissions.”
The leeway emissions are the only portions of the world’s energy economy available for manipulation to reduce overall CO2 emissions.
The Kyoto Protocol, covering many developed nations but not the U. S. Copenhagen Cancun (2010) to negotiate a new treaty to follow Kyoto
Greenhouse gas emissions are a global problem, demanding a global solution. Once emitted into the atmosphere, CO2 and other greenhouse gases do not carry a label indicating where on the globe they originated from. Emissions from any country become the greenhouse effect problem of every country. The increase in the long-term global average temperature, and its attendant extremes of weather events, damages caused and expenses incurred, affect all the nations of the world.
Rather than continuing the unabated expansion of the use of fossil fuels, and incurring unforeseen expenses caused by extreme weather events, the nations of the world should be decarbonizing their energy. Comparable amounts of capital could be invested and comparable numbers of new jobs could be created that would be directed to developing renewable sources of energy or to implementing “zero-emissions” use of fossil fuels (exemplified by the experimental technology of carbon capture and storage). It behooves all nations to embark on greenhouse gas mitigation measures as soon as possible, and not to continue “business-as-usual”.
===========================================
Details.
Historical trends for energy use and CO2 emissions for China
Trends for coal and oil use in China India China India
Use of coal is shown below.

Use of coal 1980-2009, million short tons/year, for China India China India
From 1997 to 2009, coal use by China India China

Total use of oil in thousands of barrels/day between 1980 and 2009 for China India China India
The distribution of the sources of energy for China India

Source: USEIA. http://www.eia.gov/countries/cab.cfm?fips=CH;
Coal is the predominant source of energy in China China
The graphic shows that coal is a large source of energy for India China India
Other than hydroelectric power, neither country had large energy sources from renewable sources such as wind and solar power as of 2008-2009.
Carbon dioxide emissions attributed to the burning of fossil fuels for the two countries are shown below.
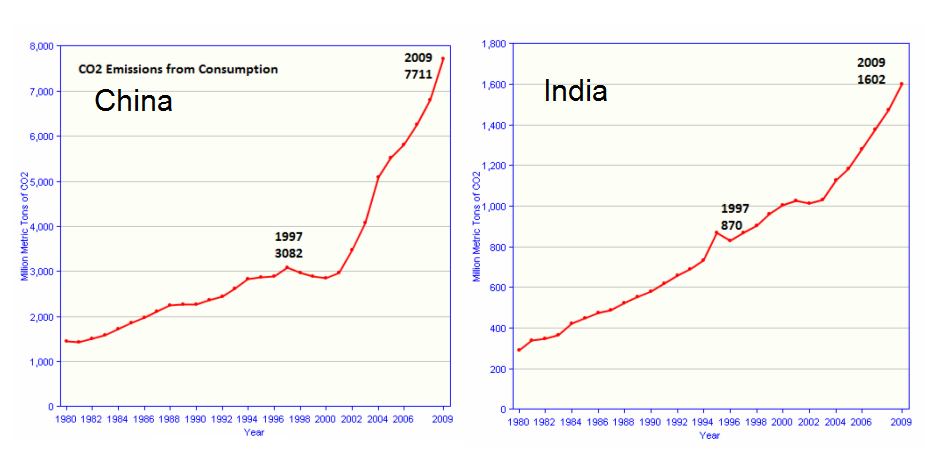
Total carbon dioxide emissions from use of fossil fuels 1980-2009 for China India China India
CO2 emissions from China India China
Projected future growth in energy use.
Consumption of all fossil fuels is projected to grow dramatically during this period. Use of coal is projected to increase from 139 quadrillion Btu in 2008 to 209 quadrillion Btu in 2035, a change of 50%. China India
Use of energy in transportation of people and goods is projected to grow through 2035 in the Reference case, almost entirely from non-OECD countries. As non-OECD countries grow economically, the demand for transportation services grows significantly, especially the demand for personal cars. Energy consumption in transportation almost doubles, growing at a rate of 2.6%/yr in the non-OECD countries, but only at 0.3%/yr in OECD countries.
Renewable energy across the globe is provided largely by hydroelectric generation and wind; solar generation currently plays a much smaller role. In OECD countries, the major growth in renewables through 2035 is expected to come from wind and solar power, as potential hydroelectric sites are already fully developed. In non-OECD countries, however, hydroelectric generation is still growing at a fast pace as dam sites continue to be exploited.
Electricity generation in China is expanding very rapidly, and is expected to continue to do so (USEIA China Analysis 2011). In 2008 the generating capacity was 797 GW of which almost 80% was generated from coal. It is expected that by 2020 the capacity will double to 1,600 GW, and to generate 3 times as much electricity by 2035 as was produced in 2009. To accommodate this increased capacity, the Chinese are also aggressively expanding their transmission grid. Since most of the generating capacity comes from conventional thermal sources supplied largely by burning coal and natural gas, it is to be expected that emissions of CO2 will increase correspondingly. The government of China
Among renewable sources, hydroelectric power plays a larger role in China China
Electricity generation in India. India India
Projections of future energy use under the USEIA’s Reference case are drawn from IEO and tabulated here.

Source: USEIA, International Energy Outlook 2011 http://www.eia.gov/forecasts/ieo/pdf/0484(2011).pdf
===============================================
Notes:
1. Current OECD member countries included in this IEO are the United States, Canada, Mexico, Austria, Belgium, Chile, Czech Republic, Denmark,
Finland, France, Germany, Greece, Hungary, Iceland, Ireland, Italy, Luxembourg, the Netherlands, Norway, Poland, Portugal, Slovakia, Slovenia, Spain, Sweden, Switzerland, Turkey, the United Kingdom, Japan, South Korea, Australia, and New Zealand.
2. OECD+: OECD as in Note 1 plus Bulgaria Cyprus Latvia Lithuania Malta Romania
OME (other major economies), Brazil China India Indonesia Russian Federation Middle East ;
OC (other countries), the world other than OECD+ and OME.
© 2011 Henry Auer
The recent scientific findings show that while CO2 is increasing, the total greenhouse gases have not significantly done so in the last 60 years. This is due to the drop in upper atmosphere humidity with rising CO2. This allows more heat to escape into space which more than offsets the slight warming caused by CO2. The net result is a cooling effect, not warming. Loss of atmospheric humidity will always trump the effects of increasing CO2. The dryer it gets, the colder it will become. The net effects of increased CO2 is to cool the upper atmosphere, not warm it.
ReplyDeleteFebruary 28, 2012 5:55 PM
why would the President say this is the number one issue in the world when ISIS, the economy, jobs, etc. are the most important issues for the American people now.
DeleteThis blog presents a clearer picture on how greenhouse emissions are building up in developing countries. Thus, the need to enhance carbon management.
ReplyDeleteVery educative and informative write-up. Do you have the latest, especially how China and India are performing on their 40% and 25% goals of reducing energy intensity? Madhav Karki, ISET-Nepal.
ReplyDeleteWhile it is true that China and India need to severely cut their CO2 emissions, are the nations truly using more energy than other countries relative to their population? You mentioned that "China and India consumed 21% of the world’s energy in 2008." Although it is a large proportion they do contain 35% of the world population. Countries should not be singled out as every country contributes to the excess CO2 production and they should all do their part to limit it.
ReplyDeleteOverall it is good to see that the OECD is not only taking steps to reduce emissions but is also looking for methods to remove excess CO2 from the atmosphere such as planting trees which is shown in China's plan in the Cancun Agreements. I think the best thing countries can do right now to reduce emissions is to invest in alternate forms of producing electricity rather than burning coal, because the graphics show extreme uses of coal relative to other energy sources which fills the air with massive amounts of CO2. Burning coal is unnecessary because we have the technology now with solar panels, wind turbines, etc. to produce "green" energy.
Ben Sentz
nice post
ReplyDeleteVery nice collection, thanks for sharing…
ReplyDeleteAluminium Scaffolding Rental In Delhi
This is my first visit to your blog, your post made productive reading, thank you. climate change articles
ReplyDeleteVery informative and impressive post you have written, this is quite interesting and i have went through it completely, an upgraded information is shared, keep sharing such valuable information. IEO Marketing
ReplyDelete