Introduction. Contemporary climate scientists have been
monitoring the atmospheric concentration of carbon dioxide (CO2), a
major greenhouse gas, for many decades.
Prior to that, paleoclimate scientists, those who seek to reconstruct
ancient climates using the geological record, have examined CO2
contained in ice cores drilled in major glaciers and ice fields, among other
modalities for estimating ancient CO2 amounts. The present measured level of atmospheric CO2
exceeded 400 parts per million (ppm; volumes of CO2 contained in 1
million volumes of air) for the first time last week. The popular news media picked up on this
landmark event as an indicator of a worsening trend in global warming; in fact
this situation has been a dire one for some time without the human esthetic
preference for a round “hundreds” number.
This post presents
the contemporary record of atmospheric CO2 and places it in the
context of an extended paleoclimate record.
The present atmospheric CO2 content and trends are indeed
unprecedented for the past 800,000 years.
The Contemporary
CO2 Record. Charles Keeling began direct measurements of
atmospheric CO2 levels in 1958 atop the Hawaiian volcano Mauna Loa , at 13,678 ft (4,169 m), in 1958. Those measurements continue to the present
day. The site was chosen to avoid major
influences of human activity in more civilized or urban settings; it is isolated
in a large ocean, and not affected by large populations. Generally, measurements taken at this location
are thought accurately to reflect CO2 emanating from at least the
entire Northern Hemisphere. The Mauna Loa record up through 2012 is shown in the
following graphic.

On May 9 the CO2
concentration was recorded as 400.15 ppm.
Source: Scripps
Institution of Oceanography presenting data gathered at the U. S. National
Oceanographic and Atmospheric Administration facility on the summit of Mauna Loa , Hawaii May 20,
2013 . http://keelingcurve.ucsd.edu/.
Two features of the
graphic are important. It shows that
atmospheric CO2 has been increasing, from about 317 ppm in 1958, to
just less than 400 ppm in 2012. It
surpassed 400 ppm on May 9, 2013
(accessed May 21, 2013 ).
There is no evidence that the accumulation of atmospheric CO2
is slowing down. Second, the rate
of accumulation of atmospheric CO2 is also increasing. A quick glance at the graphic shows that an
averaged line for CO2 accumulation is getting steeper. Indeed, the rate of increase of CO2 concentration has grown from about 0.7 ppm per year in the late 1950s to 2.1
ppm per year during the last 10 years.
(The measurements are so accurate and sensitive that they reflect seasonal fluctuations seen as annual waves, higher in the northern hemisphere winter, when green plants are quiescent and humans produce more CO when heating their homes, and lower in summer, when green plants remove CO2 from the air and generally less fuel is used for space conditioning.)
The “Recent”
Historical Record. Now we will examine the CO2 dating
from the year 1700 CE (common era). CO2
concentrations for the atmosphere from times before the Mauna Loa measurements began are obtained from
glacial ice cores. As snow and ice fall
onto glaciers of the Arctic and Antarctica small bubbles of air are entrapped by the solidifying
ice. Eventually the ice is solid enough that
its entrapped air bubbles cannot equilibrate with the ambient atmosphere any
more; the bubbles then entrap air representative of the time at which the
precipitation solidified. These air
bubbles are harvested by climate scientists in time sequence by drilling ice
cores, about 5 in (12.5 cm) across and capturing the bubbles as they are
released in a carefully controlled laboratory environment. The cores are layered year by year, so it is
easy to enumerate the age of the bubbles.
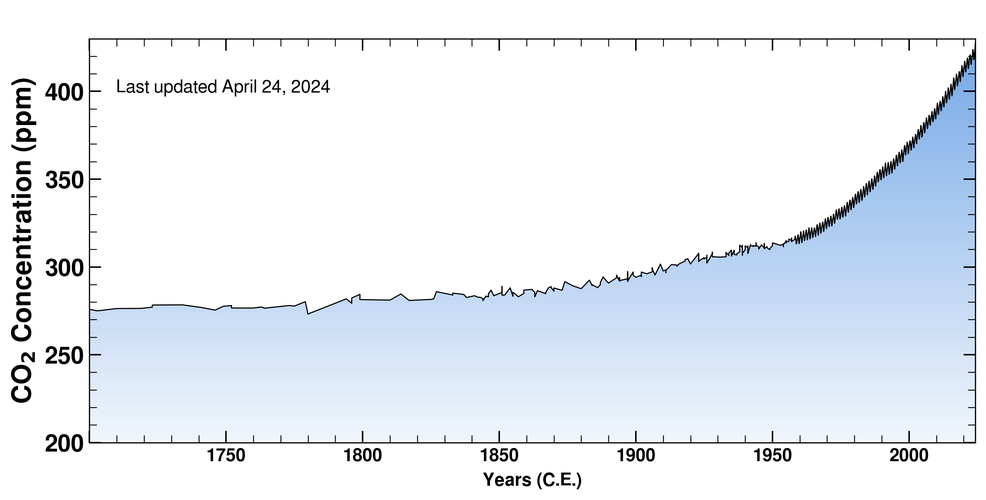
The following
graphic shows the atmospheric CO2 concentration from 1700-2012
CE. Ice core data were used for
1700-1958, and the Mauna
Loa atmospheric
record, as shown above, for 1958 to the present.

CO2
concentrations for the period prior to and through the Industrial Revolution,
from 1700-2012 CE. Data from ice cores
for 1700-1958, and from the Mauna
Loa record after
1958. This image is the same as
presented in the last graphic below, in Panel B). Source: Scripps Institution
of Oceanography; http://bluemoon.ucsd.edu/co2_400/co2_800k_zoom.png
The atmospheric CO2
concentration is essentially unchanged from 1700 to 1800, showing that
additions to the atmosphere from, for example, decay of vegetation and human
use of firewood, was balanced by photosynthetic uptake and other processes that
deplete CO2. But as the
industrial revolution took hold after 1800, and expanded radically in the 20th
and 21st centuries, the concentration grows higher and higher, and
at more and more rapid rates, as time passes.
The emission of CO2 into the atmosphere and its removal are
no longer in equilibrium because of the additional burden of CO2
emitted arising from burning fossil fuels to power the industrial
revolution. This is more than a simple
surmise or hypothesis. A particular
physical property of the CO2 in the atmosphere changes with time
along a path that follows essentially the exact same curve with time. This property is one that shows conclusively
and without question that the added CO2 originates from fossil
fuels. It is concluded that human
activity, burning fossil fuels for energy that powers industrialization around
the world, is the cause of the sharply rising CO2 concentration in
the last 160 years.
The Paleoclimate
CO2 Record. Ice cores from Antarctica , extending as deep as about 9,840 ft (3000
m) provide CO2 concentrations going back 800,000 years. Results are shown in the graphic below.
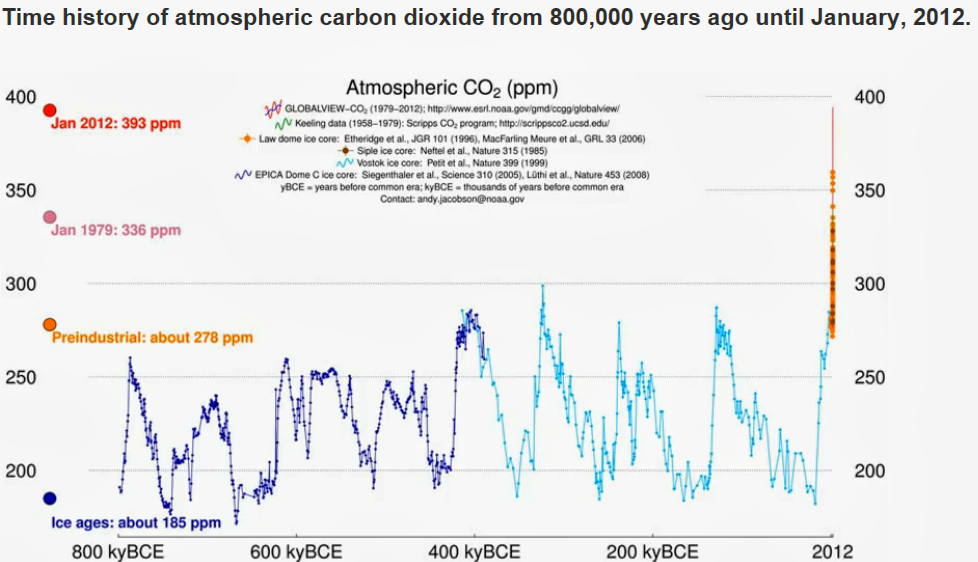
Source: U. S. May 21, 2013 ).
This dramatic image
shows that atmospheric CO2 levels oscillated over geological time
scales of several hundreds of thousands of years, with many increases and
decreases. The changes, when compressed
to this time scale appear to be abrupt and sudden (discussed further
below). Nevertheless, the highest
concentration over this time scale is usually under about 280 ppm, and attained
about 300 ppm on one excursion. High
concentrations of CO2 would correspond with warmer climates,
reflecting the greenhouse effect of the gas.
There are, furthermore, several periods below 200 ppm.
It is highly
significant that practically the entire record for the time of the industrial
revolution has higher CO2 concentrations than found throughout the
800,000 year interval illustrated above. Thus, although popular
interest focused last week on the fact that concentrations exceeded the round
number of 400 ppm, it is far more significant that CO2
concentrations have been above levels found in the 800,000-year geological
record for the entire time since the industrial revolution began. Humanity’s burning of fossil fuels has
disrupted the natural CO2 cycle that has existed geologically for at
least 800,000 years in unprecedented quantities and with unprecedented speed.
Contemporary CO2
emissions vastly exceed geological emission rates. The
previous graphic includes many periods in the geological record that appear to
the eye of the casual observer to show rapid emission (or depletion)
rates. Visual images can be very
powerful in this regard. But it is
critical to scale the sharp changes to the very long time scales shown on the
horizontal axis above.
This writer has
consulted the raw data table for the points shown in the graphic above,
and selected one period of seemingly abrupt change in CO2
concentration, in the period spanning 128,609 and 135,603 years BP. The results are shown in Panel A) of the
graphic below.

A) CO2 concentrations
obtained from Antarctic ice cores for the interval 135603-128609 years before
the present (i.e., the time axis runs left-to-right from more ancient to more recent). Each vertical line marks a 500-year
interval. Data extracted from the
800,000 year record in Luthi et al., Nature 2008, Vol.
453|doi:10.1038/nature06949.
B) CO2
concentrations for the period prior to and through the Industrial Revolution,
from 1700-2012 CE, compressed by this author so that the 300 year interval
occupies about the same horizontal distance as it would if it were displayed in
panel A) (the time axis runs left-to-right from 1700 to 2012). This image is the same as presented in the
second graphic, above. Source: Scripps Institution of Oceanography; http://bluemoon.ucsd.edu/co2_400/co2_800k_zoom.png.
It is seen that in
fact what appears to be an abrupt change in the compressed geological image
further above is in fact quite extended.
The CO2 concentration rises from 198 to 287 ppm, or 89 ppm, over
a very extended span of 6,994 years, or by 0.013 ppm/yr.
In contrast, the
change in CO2 concentration over the industrial revolution is shown
in Panel B) in the graphic above. This
is in fact the identical image as shown in the second graphic of this post,
covering the 310 years from 1700 to 2012 except that the time scale has been
drastically shrunk so that it is about the same time scale as in the geological
excerpt of Panel A) (in which each vertical line marks off 500 years). It is immediately apparent that
a)
the
chart in Panel B) starts at a CO2 concentration near the maximum of
the geological CO2 record, about 280 ppm and climbs sharply to the
400 ppm level discussed earlier; and
b)
the rate
of change of the CO2 concentration in Panel B) is very much
steeper than that found in the geological record, averaging to about 0.75
ppm/yr; this is almost 60 times more rapid than the geological change noted
above.
Conclusion
This post has shown
that
a)
geological
changes in CO2 levels have practically never exceeded 280 ppm, the
level that existed just before humanity embarked on the industrial revolution;
b)
on a
time scale relevant to human experience and lifetimes geological changes in CO2
levels change extremely slowly, over periods of many thousands of years;
c)
physical
properties of atmospheric CO2 today show unequivocally that the
excess CO2 arose in the past century from burning fossil fuels;
d)
virtually
the entire increase in contemporary CO2 levels has resulted in
concentrations so high that they have never been found in the geological record
for 800,000 years;
e)
contemporary
CO2 levels continue to increase unabated and at a rate 60 times or
greater than in the geological record; and
f)
the rate
of growth of contemporary CO2 levels is accelerating.
No comments:
Post a Comment