We experience weather
at the local or regional level. Here, one
person may be in a heavy rainstorm, while there, somewhere else in the world, another
could be in an uncomfortable heat wave. Daily
or weekly weather, however, is not the same as long-term regional or global
climate; climate relates to yearly, multi-year, and even decade-long behavior.
The world’s climate
is affected by the atmospheric accumulation of greenhouse gases (GHGs), which
continued unabated during 2013. GHGs in
the atmosphere preferentially retain heat radiating from the earth’s surface
and prevent its escape to space.
Record High
Levels of Carbon Dioxide. The World Meteorological Organization (WMO ), an agency of the United Nations, reported recently
that the global average concentration of carbon dioxide (CO2), a
major GHG, reached a record level of 396 parts per million (ppm; volume of CO2
gas in 1 million volumes of air) in 2013 (see the graphic below).

Atmospheric
concentration of CO2 in ppm, reported monthly from 1984 to the
present.
The WMO evaluates observations gathered from many
land-based stations, ship-based observatories and aircraft. The increase in CO2 from 2012, 2.9
ppm, was the largest yearly change since 1984.
The present CO2 concentration is 42% higher than that before
the industrial revolution began during the century between 1750 and 1850. The dramatic increase in CO2
emissions in the last 160 years, coinciding with the increasing role that fossil
fuels have played in powering the world’s economic growth during that period,
is shown below.
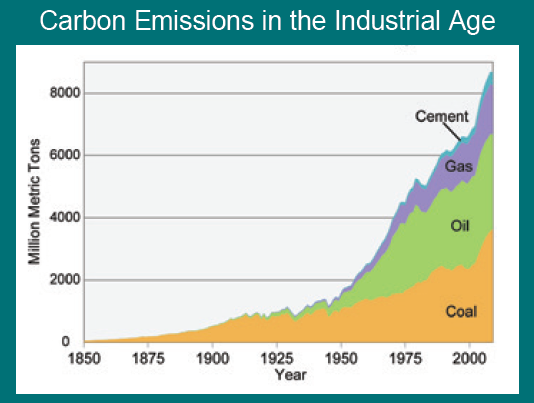
Source: The Third U. S.
National Climate Assessment (data from Boden et al. 2012); www.nca2014.globalchange.gov
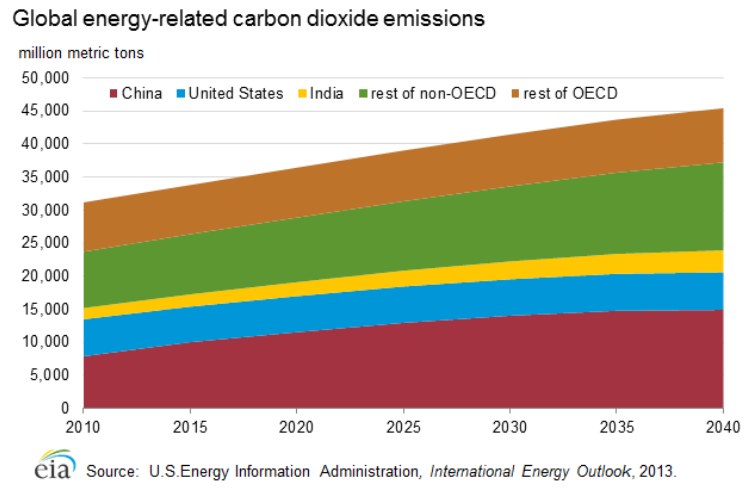
Even more recently
the New York Times reported
that another international group of climate scientists likewise found that GHG
emissions in 2013 reached record levels.
Worldwide this group found that the increase from the previous year was
2.3%, while in the U. S.
Why should we
care about this pattern in CO2 levels?
As atmospheric CO2
levels trend higher the long-term worldwide average temperature of the earth’s
atmosphere has also been increasing, in concert with the increasing
concentration of CO2 (see the graphic below). This has been happening because of the
greenhouse effect of CO2 and other greenhouse gases (also reported
by the WMO ).

The increased CO2 levels arise directly as a
result of humanity’s burning of fossil fuels for energy, and not from natural
causes (see also the U. S. National Climate Assessment (a U. S.
There have been
many reports over the past several months documenting increasing GHG emissions and warmer long-term
global average temperatures. These
include the Fifth Assessment Report of the United Nations-sponsored
Intergovernmental Panel on Climate Change, the Third U. S. National Climate Assessment,
and the two reports mentioned here. The
persistent drumbeat of reports on global warming emphasize the conclusion that
the increase in atmospheric CO2 and the resulting increase in global
average temperature are manmade: they originate from humanity’s burning of
fossil fuels for energy to drive economic development.
Higher worldwide
temperatures are leading to more, and more extreme, climate and weather events. For
example, warmer temperatures permit the atmosphere to hold more water vapor, so
that many regions will likely experience heavier rain and snow, leading to
flooding. In other areas, higher temperatures
will likely increase evaporation of moisture from the land leading to
drought. Both flooding and drought can
reduce crop yields, leading to higher prices or famine. Sea levels are rising as land-based ice
sheets and glaciers melt, with the runoff entering the ocean. All these trends lead to physical and
socioeconomic harm to humanity as extreme patterns and catastrophes inflict
more damage than in earlier times.
Human health is likewise
significantly harmed, as air quality is degraded and as warmer conditions make
it easier for disease-bearing microorganisms to flourish and infect the
population.
Increased emission of
GHGs is a worldwide problem requiring a worldwide solution. The
international community is currently beginning final negotiations on a
worldwide treaty to reduce GHG emissions, undertake adaptation measures and
assist those nations most adversely affected by global warming. The participating nations must approach these
negotiations in good faith, with an eye to the future, so they can agree to
meaningful abatement and adaptation policies.
Our wellbeing, and that of future generations to follow, demands no
less.
© 2014 Henry Auer